BIKEPGH MESSAGE BOARD ARCHIVE

« Back to Archive
18

Crowdsourced bike map

See http://www.commutebybike.com/2014/10/24/new-crowdsourced-bike-safety-map-bikemaps-org/ Kind of cool. You can report bike theft, accidents. Maybe we could integrate it with some of our local info.
jonawebb
2014-10-24 15:44:49
The visualization of rider density via Strava is well done (nice graphics, display is fast). How do they distinguish people in cars or on foot from people on bikes, however? If the software looks at speeds and assumes that, say, anybody traveling over 30mph is in a car and anybody traveling under 30mph is on a bicycle, that's too error-prone. And the data seems to be skewed toward the sort of people who use Strava, which I guess would be recreational road and mountain bikers. On their web site, note how heavy the traffic appears in Frick Park. It seems that bike commuters are under-counted. more detail
paulheckbert
2014-10-25 23:10:11
1
mikhail
2014-10-26 00:54:14
Paul, You can use Garmin and import data to Strava directly or synchronize Strava account with GarminConnect (CopyMySports) or or you can use Strava application for Android or iOS (or similar apps from Garmin) and chose activity in those applications. Usually two are available -- Biking and Running. So Strava uses this info to build heat map (personal) and total heat map is based, I believe, on personal data.
mikhail
2014-10-26 00:55:27
Following on Paul's comment: The applicability of Strava data to represent actual cycling patterns is quite problematic. You'll remember how the new technology of phone surveys led newspapers to declare Dewey president over Truman (since phone users skewed differently than voters) Similarly, Strava usage patterns represent cycling by QuantifiedSelf-type cyclists with smart phones. That demographic is skewed by income and discretionary time, which brings class and race into the picture. So for instance, poor people riding to work on cheap beater bikes is not in anyway reflected in Strava numbers. This is an important component of bikes-as-transit that would be completely ignored if we use Strava data to plan bike infrastructure. But Strava is a business, with something (data) to sell - and they package it and hype it, there's no alternative dataset, and uninformed politicians purchase the data and rely on it. Final geek aspect: Strava is selling data, not information or knowledge. We now return you to the thread in progress.
vannever
2014-10-26 08:33:40
So for instance, poor people riding to work on cheap beater bikes is not in anyway reflected in Strava numbers. This is an important component of bikes-as-transit that would be completely ignored if we use Strava data to plan bike infrastructure.
Well, Strava is kind of "exercise and sport promoting" so apps for smart phones is idea to extend reach (which is good from their business point of view). Most of data are related to sport activity -- a lot of racers and just falks who consider running/biking is a good way to support a certain physical level. And I saw a lot different people from different income range doing it and logging data on Strava. But Garmins are more preferred way for those people. Regular commuter rarely log their data to Strava (I believe Endomondo is preferred due to some famous challenge:)) unless those commuters are Cat 6. :) I have Garmin and log rides if I am on my road bike, but I log commuter miles to Endomondo and very often without any routes (Endomondo app eats way too much battery on my Android).
mikhail
2014-10-26 12:12:44
my next soft-porn-slash-geek-erotica romance novel will be titled "The Seductive Lousy Numbers". this is a Strava heat-map of Pgh to Cumberland MD this is a Strava bike heat-map of Meyersdale PA, with the three hot spots identified which leaves me thinking, it's not a bad way to find out where "some" (a-r) cyclists go in a strange town.
vannever
2014-10-27 21:41:17
Yes, in Pittsburgh, you can see clumps at OTB, Performance Bikes, East End Food Coop, and other cyclist hangouts. Also, what's going on in the middle of Frick Park (center of picture below)? Isn't this where Dynamo Soccer games take place?
paulheckbert
2014-10-28 00:15:16
@paulheckbert: Isn't that where cyclocross practices are/have been held?
reddan
2014-10-28 08:49:14
You can also see a concentration on 8 different Dirty Dozen hills on the map. Definitely shows some self-selection in their user base. Paul, that's not a soccer field in Frick Park. That's the top of the hill across from one of the exercise stations. Maybe someone is doing laps around the top of the hill?
abm760
2014-10-28 09:04:11
I think one thing that is telling is areas with light highlighting, where there is demand, but possibly a lack of good accommodations for cyclists who might otherwise use this or an adjacent route if better facilities would be provided. See Hazelwood, east st, routes to south hills, Rankin.
benzo
2014-10-29 08:27:23
I would really like to see some believable data on who's riding where. This Strava thing doesn't do it. It's as if nobody ever gets on a bike in the Hill, south of Mt Washington, or east of Swissvale Avenue, of what I can see here. Must be plenty of people who bike somewhere, just that they don't drop a couple hundred bucks on a thingy to keep track of it.
stuinmccandless
2014-10-29 14:42:04
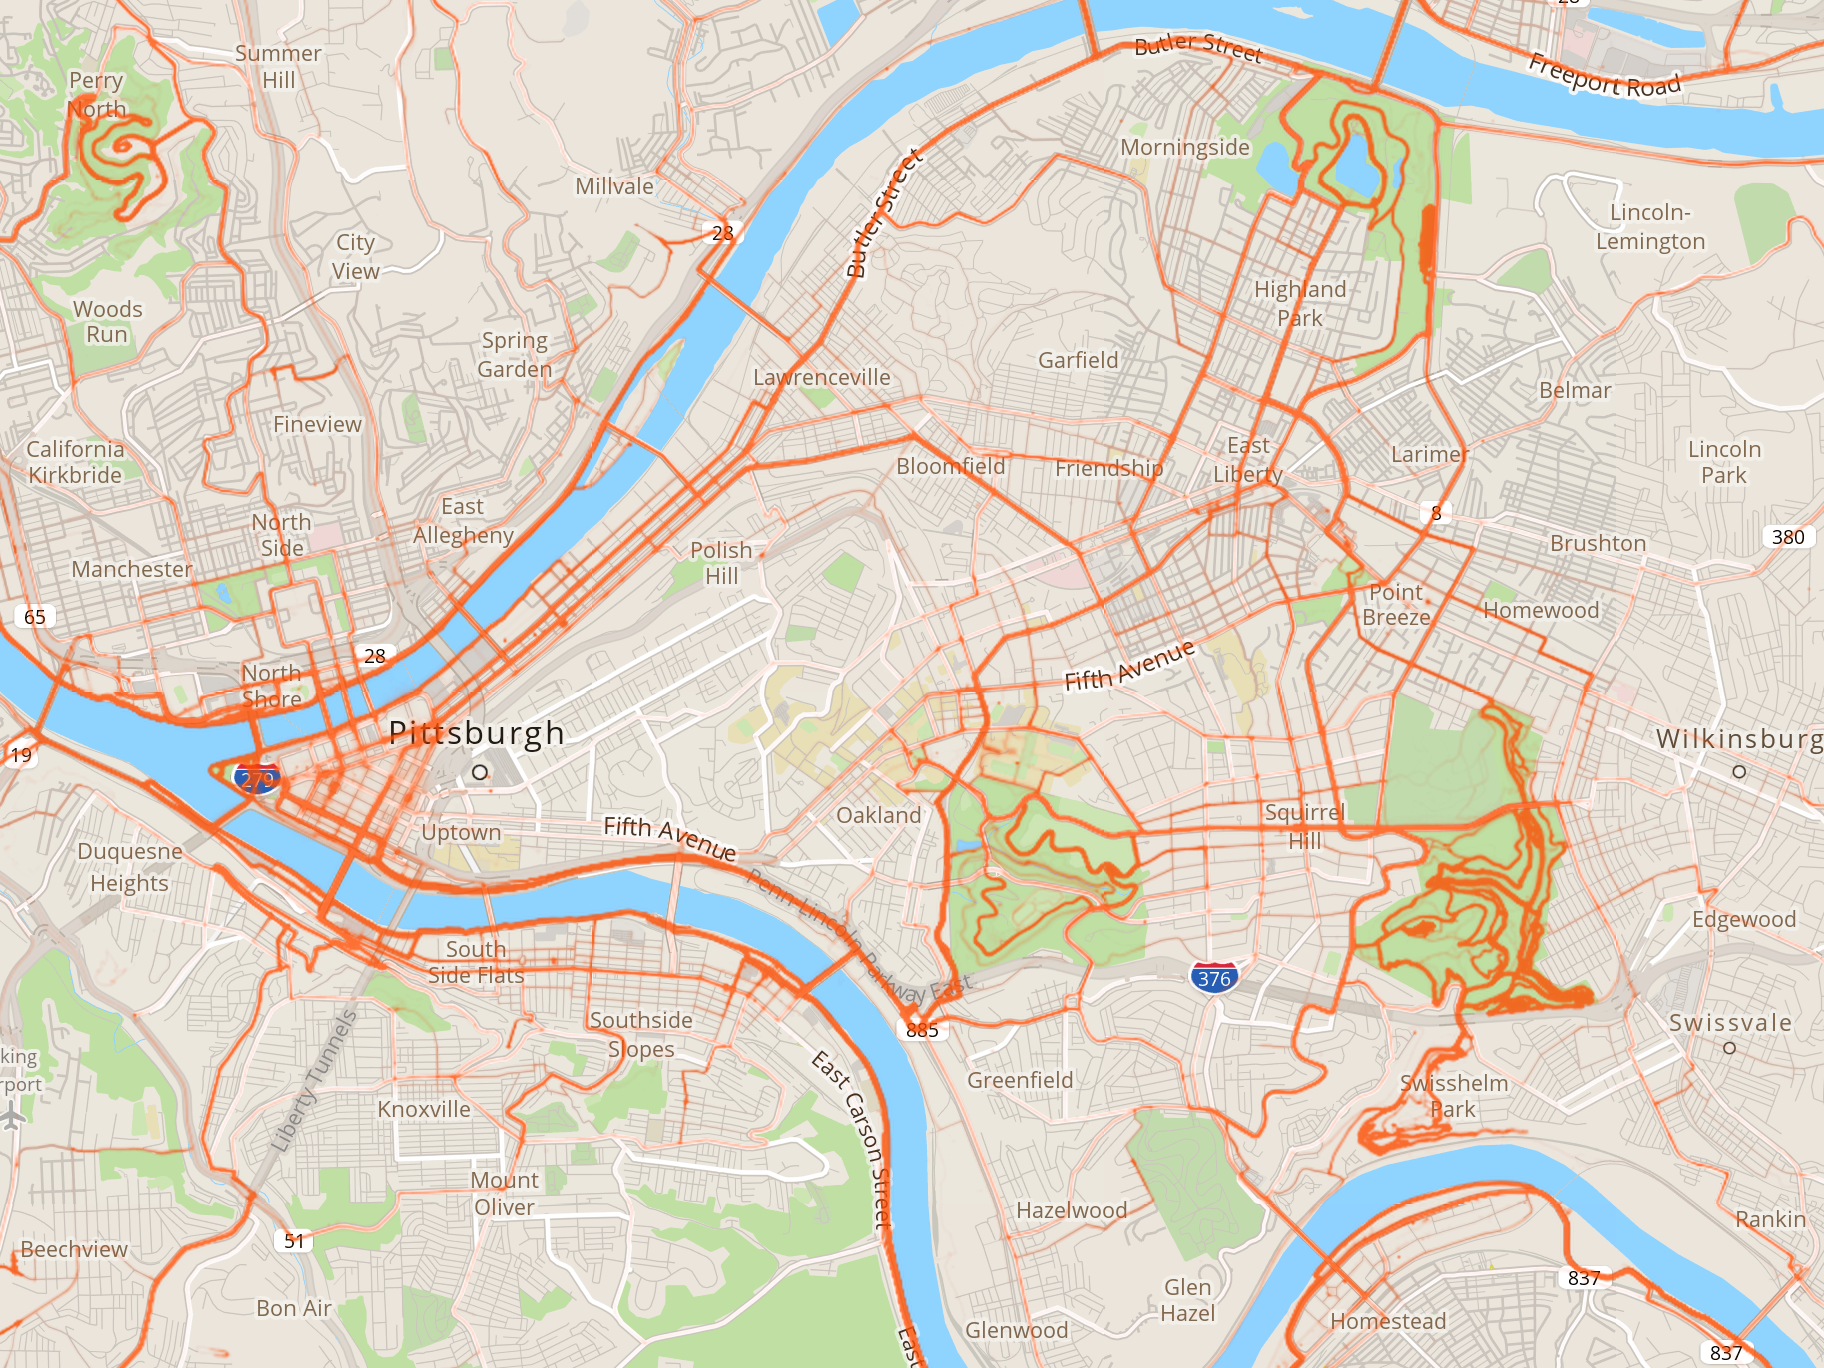
These maps are really interesting. But I think the way that Strava (and bikemaps.org) visualize cyclist volume is fundamentally flawed: it is skewed toward emphasizing curving or slow routes (e.g. traveled by mountain bikers) and de-emphasizing straight, fast routes (e.g. by road riders). It appears that Strava creates their heatmaps by placing dots on the map for each data point coming from the GPX (or other) input files, and that Strava never gave much thought to what exactly they were visualizing, so they’re not normalizing the input data. Some info on their maps here: http://engineering.strava.com/global-heatmap/. They're more focused on systems details than statistical concepts. If you were to add one dot for each unit distance traveled, that would give you a map where color shows the number of cyclists passing a given point. I think that’s the visualization most people would want to see. Let’s call that “unweighted statistics”. If you were to add one dot for each unit time, that would tend to emphasize places where people bike slowly (e.g. hills, rough surface) or stop (e.g. coffee shops, homes). Let’s call this “time-weighted statistics”; it would tell you the probability of finding a Strava enthusiast at a given location. If the GPS sensor is noisy, I imagine the track would tend toward time-weighted statistics. The GPX files generated by my Garmin Oregon 450 contain point sets that are neither of these two, but appear to have had collinear points filtered out. We could call this “curve-weighted statistics”, since it generates more points on curves and fewer on straightaways. Since most GPS devices seem to output time- or curve-weighted statistics, and Strava doesn’t seem to be normalizing the data points it gets as input, but is displaying them raw, Strava is giving us a time- or curve-weighted map. Strava should normalize their maps to be unweighted. Of course, there are other biases to Strava’s maps, e.g. weighted toward competitive people with money and time to burn, but those are harder to fix.
paulheckbert
2014-10-29 18:30:12
Quite so, Paul. They tend to consider as "hot" places where cyclists loiter; so the train station in Meyersdale is very hot, much more than the trail on either side of it. But there's no significant traffic riding loops around Meyersdale station, just people slowing down, maybe leaving their device running while they go inside (although some auto-sleep)
vannever
2014-10-29 21:34:56
Related to mapping, the following might be of interest: Google Earth Pro, a version of Google Earth with extra information layers, is available for free as described at http://www.google.com/intl/en/earth/download/gep/agree.html . See the note there about the license key you need to type in after download. The features of note are layers that show data on car traffic on heavily-traveled streets and property parcel information: https://www.youtube.com/watch?v=VBQKPhs5Wr0
paulheckbert
2015-02-15 02:22:26
Interesting. I see that 5th Ave is not a state road (though Baum is). So why do I keep hearing about it not being possible to change its speed limit since it's a state road? (or something) For that matter, Forbes-Beeler-Wilkins is a state road; why is it not 35mph? How could that be allowed? Also, speed limit enforcement.
ahlir
2015-03-30 19:06:31