A look at how density, population, and elevation may affect bicycling rates
When it comes to biking, there are a lot of factors that impact where people in Pittsburgh ride and why. As we reported from the Green Building Alliance’s Make My Trip Count survey, bicycling is on the increase in Pittsburgh, though different neighborhoods experience this growth in different ways.
In a deeper look into the MMTC data, we’ll look at neighborhood population and density – and because it’s Pittsburgh, a little bit of elevation – to explore where cycling survey respondents were most numerous.

Density
Pittsburgh’s densest neighborhoods are concentrated from Uptown into the East End, curving around the Hill District, with just two exceptions: Central Northside, home to the Mexican War Streets historic district, and Knoxville in the South Hills, both of which were designed and built with greater density.
With a greater number of people and, theoretically, amenities and activities in a concentrated area, a cycling population should increase with density. Especially in the connected neighborhoods from Uptown to East Liberty, the increased density and interconnectivity should point to higher rates of cycling.

Hills, Hills, Hills
Looking at slope alongside density paints a more complete picture. Take Knoxville for instance, both steeper and more isolated by the city’s topography. Not surprisingly, it show lower rates of cycling from MMTC survey respondents, likely due to these factors.
The flatter, interconnected, dense East End neighborhoods, in contrast, show higher rates of cycling from survey respondents consistent with the characteristics that predispose them to being cycling communities.

Population
The city’s most populous neighborhoods are in the South Hills and East End. With a greater population, the total number of cyclists is likely to increase. The city’s southern neighborhoods, however, contend with a hilly terrain and suburban-style density that decreases the ease and desirability of cycling.
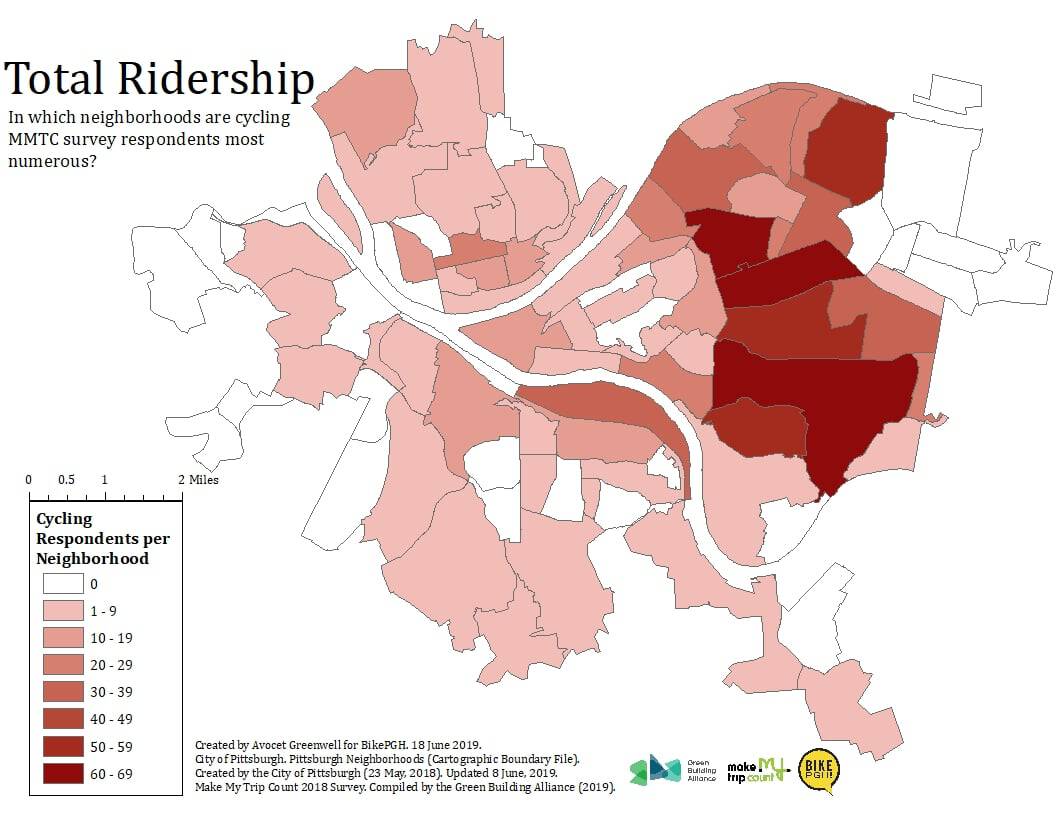
In the East End, the hypothesis holds true; the greatest number of riders are concentrated in the area.
With populous and dense areas intermingling and overlapping, the area’s density, scale, and interconnectivity are ideal in promoting cycling. Frick and Schenley Parks are nearby too, providing more opportunities for recreational cycling within easy distance.
Highland Park, while not the most dense or populous neighborhood, also shows high numbers of cyclists and rates of cycling per the neighborhood population, further indicating that access to nature and connectivity to other cycling neighborhoods are important factors.

Ridership
These factors impact the neighborhoods with the highest ridership. The majority of cycling survey respondents hail from the East End and Southside Flats – flatter areas well connected to each other or to Downtown.
As with all surveys, however, a significant limitation is getting responses. While population and density are measured by more comprehensively mandated surveys like the Census, a self-reporting survey like the MMTC survey is only as comprehensive as its respondents.
The zero reporting cyclists from Homewood, for example, shouldn’t necessarily be taken at face value. 22% of North Shore’s population is accounted for in survey responses; less than 1% of Homewood residents are. These imbalances in data can distort details, even when larger patterns emerge. Additionally, we need to also be looking at neighborhood plans, like the recently launched Homewood Comprehensive Community Plan, to get a deeper understanding of a neighborhood’s activities and needs.
Understanding where Pittsburghers ride and why is insightful not only for us, as bike and data fans, but for the city at large. With the City’s Pittsburgh Climate Action Plan 3.0 seeking to increase bicycle commute trips by 100% in the next ten years, knowing current ridership patterns can help the city plan and build for the future, filling in infrastructural gaps or bolstering existent networks.
Stay tuned for more looks into the MMTC data, including what factors would influence Pittsburghers to commute by bike!

Subscribe to The Messenger
Sign up for Bike Pittsburgh’s newsletter to get the latest news on events (including OpenStreetsPGH and PedalPGH), educational classes, and fun, delivered straight to your inbox.