This year’s biannual report dives into the City’s accomplishments and where they need to go
A part of the 2016 Complete Streets Policy requires the city to create “a report every two years measuring the progress made on the Complete Streets Policy & describing individual projects delivered.”
Unfortunately, it wasn’t until 2024 that the City’s Department of Mobility and Infrastructure (DOMI) created their first report. Two years later, DOMI is sticking with their requirement with the recently released State of Mobility Report 2026.
For those following safe streets improvements, the report is a wealth of information about safe streets projects, programs and trends. It offers a snapshot of how the City is progressing, and where they need to go, with regards to making sure Pittsburgh is safe and welcoming, no matter how you get around. It also helps set benchmarks for achieving zero traffic fatalities and serious injuries, a 2024 policy known as Vision Zero.
In addition to the summary of DOMI’s work since 2023, they also provided a five-year update on both the Bike(+) Plan and Pedestrian Safety Action Plan, both adopted in 2020. Also included are the results of the first citywide transportation and perception survey.
At the end of the report, DOMI identifies a list of key policy priorities to move the needle forward on their next phase of transportation and safety improvements for all users, not just those inside cars.
Below are some notable takeaways from the report, but be sure to read it in full.
#1: SEEING PROGRESS ON COMPLETE STREETS, EVEN WITH LIMITED RESOURCES
Even with limited resources, a limited staff, and limited funds, DOMI has really pulled off a large number of projects and programs to further Complete Streets.
For instance, they receive over 250 requests for traffic calming every year, with a total of 1233 requests since establishing the request portal. Between 2023 and 2025 DOMI completed 46 neighborhood traffic calming projects.
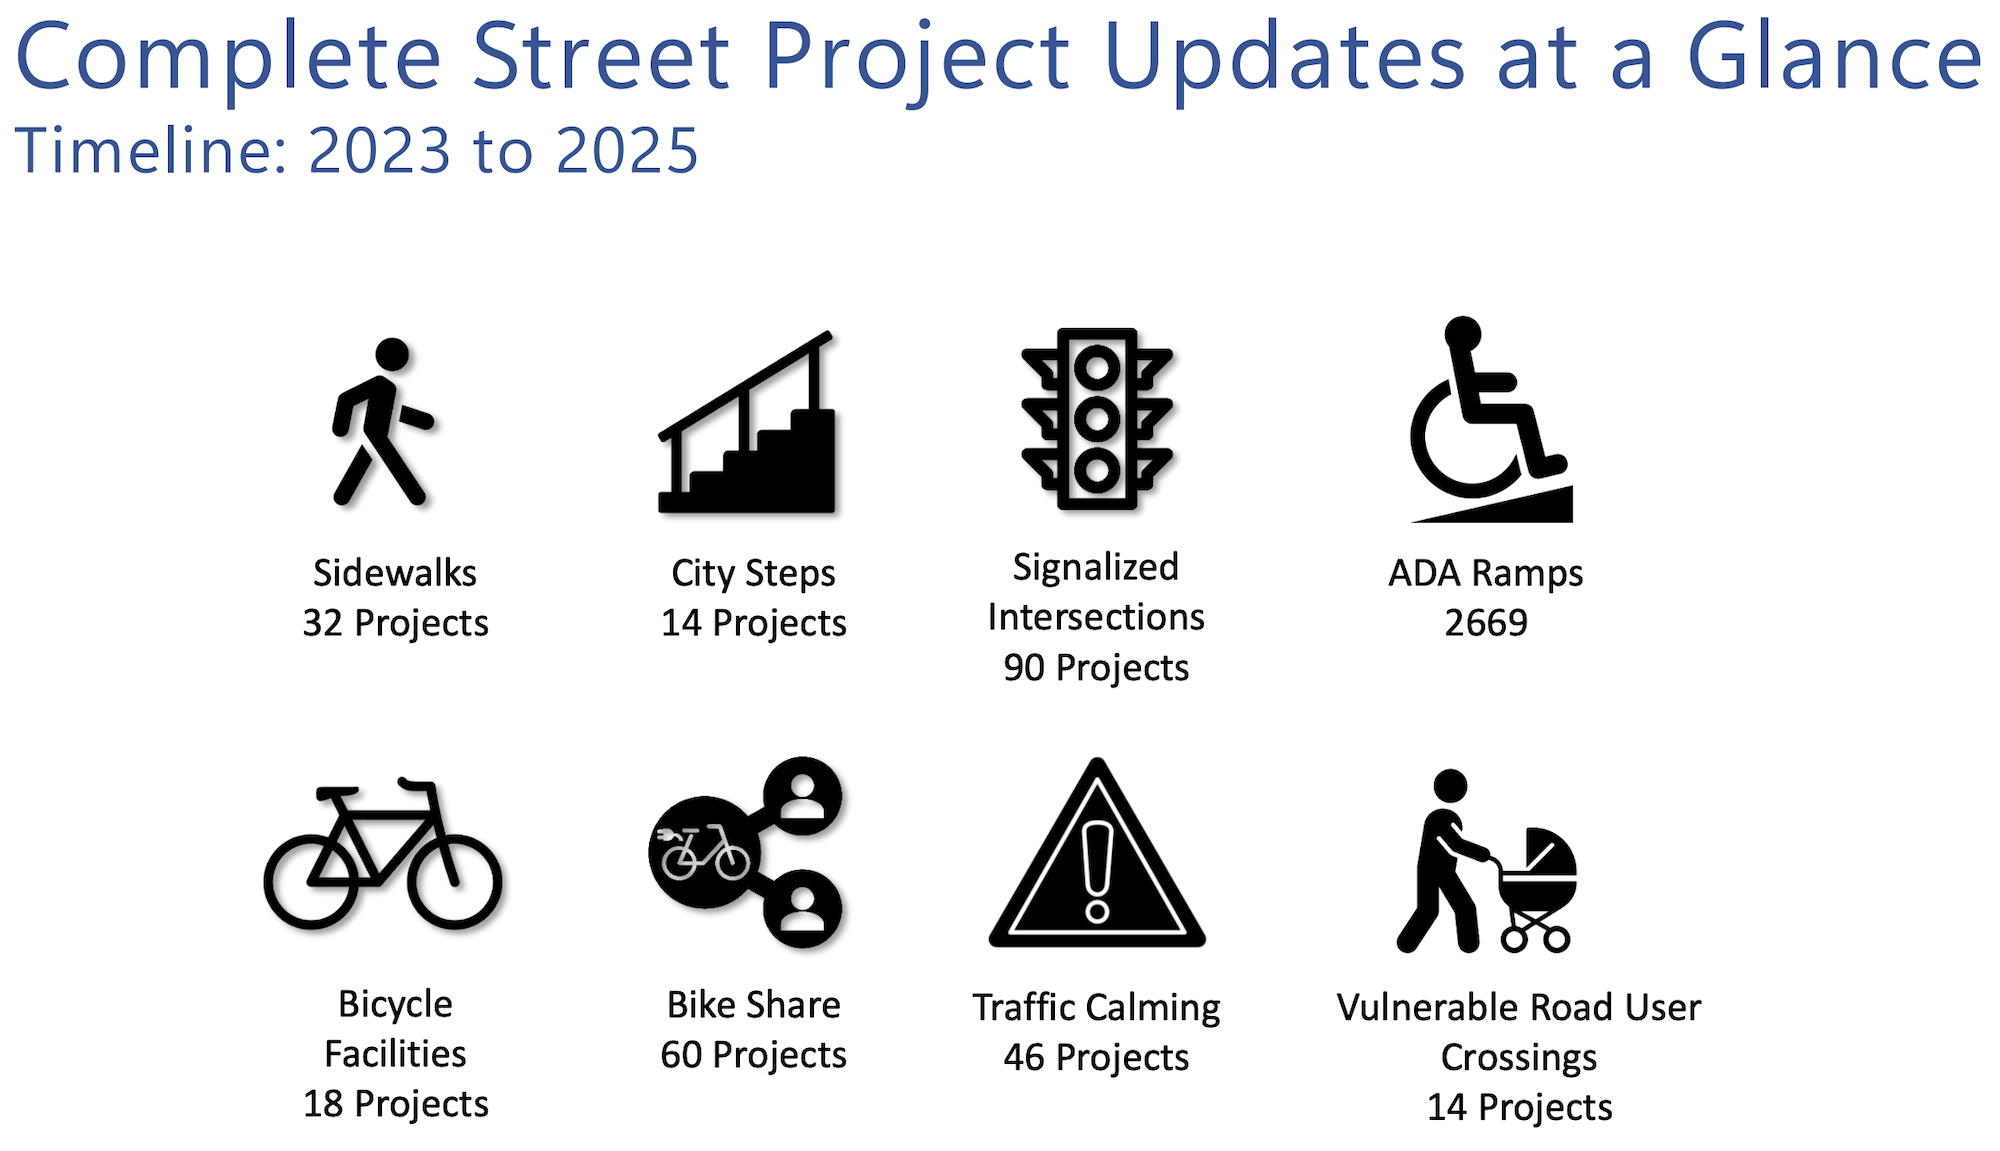
They have also put a particular focus on building safety projects within High Need Communities (HNC), defined as Justice40 communities by the federal government. Sidewalk projects are particularly notable, with 72% of these projects focused in HNC neighborhoods. Additionally, 50% of bike projects, and 65% of traffic calming projects are in HNC neighborhoods.
A standout program that has grown significantly is their Safe Routes to School (SRTS) work, some of which BikePGH has partnered on. In addition to physical safety improvements near schools, they have also begun several programmatic initiatives such as Walk and Roll to School Day, Safety Town, Safety Week, and a new Transportation Academy.
#2: TRENDS ARE SHIFTING ON HOW PITTSBURGHERS GET AROUND
The pandemic is still affecting how Pittsburghers get around. Not only are more people working from home than ever, PRT ridership has not recovered from pre-pandemic numbers. Considering PRT ridership is down, the survey findings indicate that Pittsburgh is becoming increasingly multimodal, but also increasingly car dependent with a 29% increase in Vehicle Miles Traveled. It seems that after the pandemic, people haven’t quite shifted back to transit, and are now using other means.
A concerning trend that was that ridership along the trail system declined in 2025 – something that may be attributed in part to perceptions of safety along the trails, as revealed from DOMI’s mobility survey.
POGOH bike share was a shining multimodal star in the report, showing a 170% increase in use, with 22 new stations, meaning that 42% of Pittsburghers now live within a half mile of POGOH station.
#3: State of Mobility & Safety Perception Survey provides insights
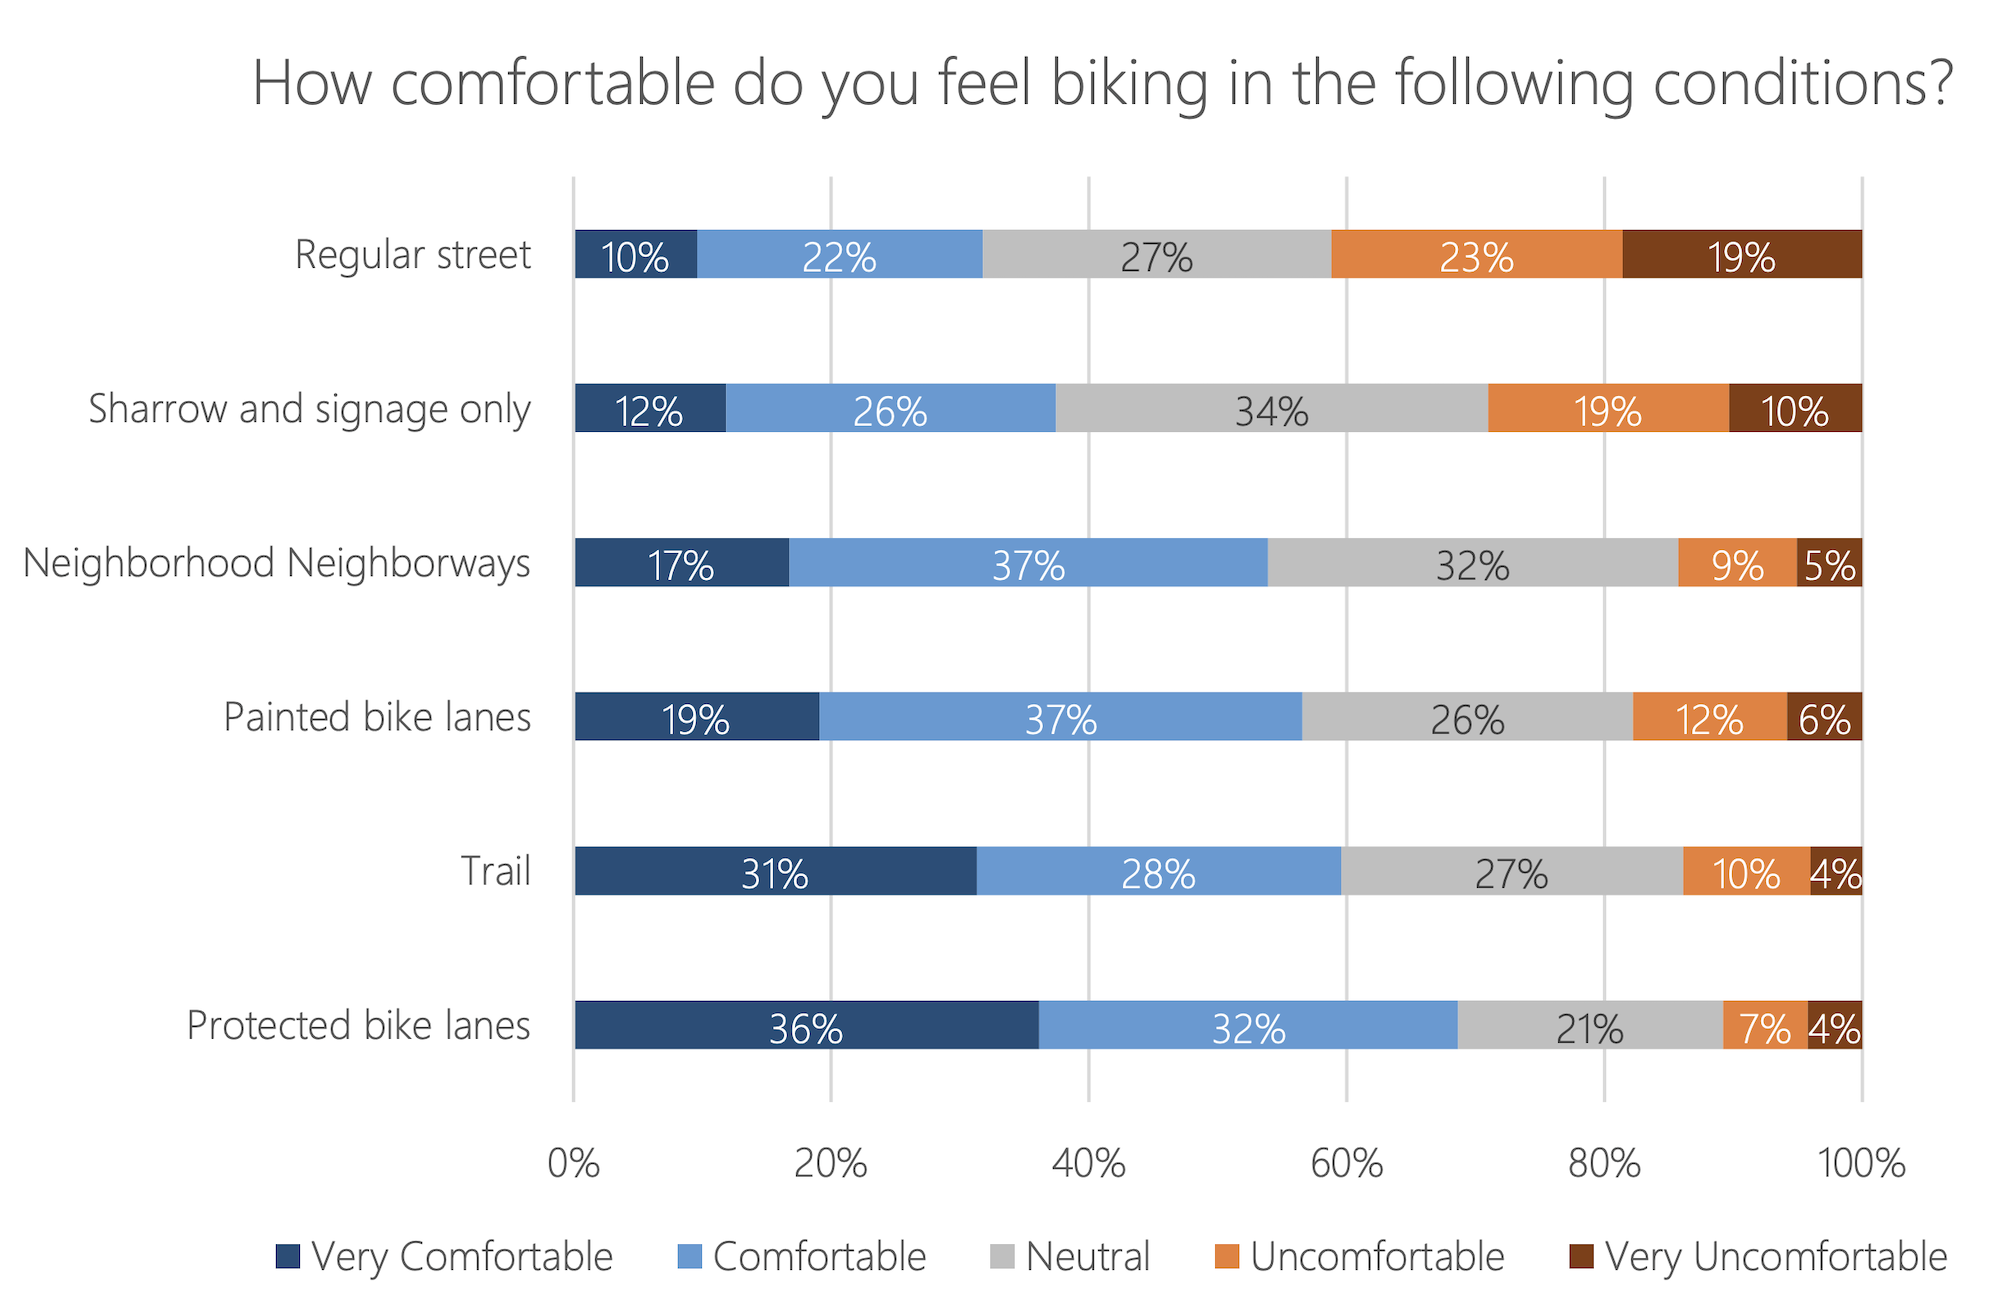
The first citywide State of Mobility & Safety Perception Survey yielded some interesting results, as well as solidifying what we already know.
Namely: We’re a walking city.
However, according to the report: satisfaction is highest among respondents who drive alone in a motor vehicle, consistent with the significant investment in car-oriented infrastructure. In contrast, dissatisfaction is highest among those who bike, suggesting that bicycle infrastructure and investment have not kept pace with the resources dedicated to automobile travel.
Unsurprisingly, residents who bike report increased feelings of safety as bike infrastructure gets more robust. Surprisingly, they feel more comfortable in Protected Bike Lanes than they do on the Trail System. Comfort is relative, and there are many factors that could go into that assessment, from lighting to cleanliness to feelings of isolation.
Similarly, when asked, “Which features most improve your sense of safety when waiting for public transit?,” respondents identified three leading priorities: well-lit transit stops, shelters with seating and protection from the weather, and clean and well maintained stops.
Also unsurprising, yet good to see evidence of, is that city residents (and less so for those who only work here) prefer safer streets over faster travel times.
#4: CRASHES ARE DOWN, BUT SERIOUS SAFETY CONCERNS REMAIN
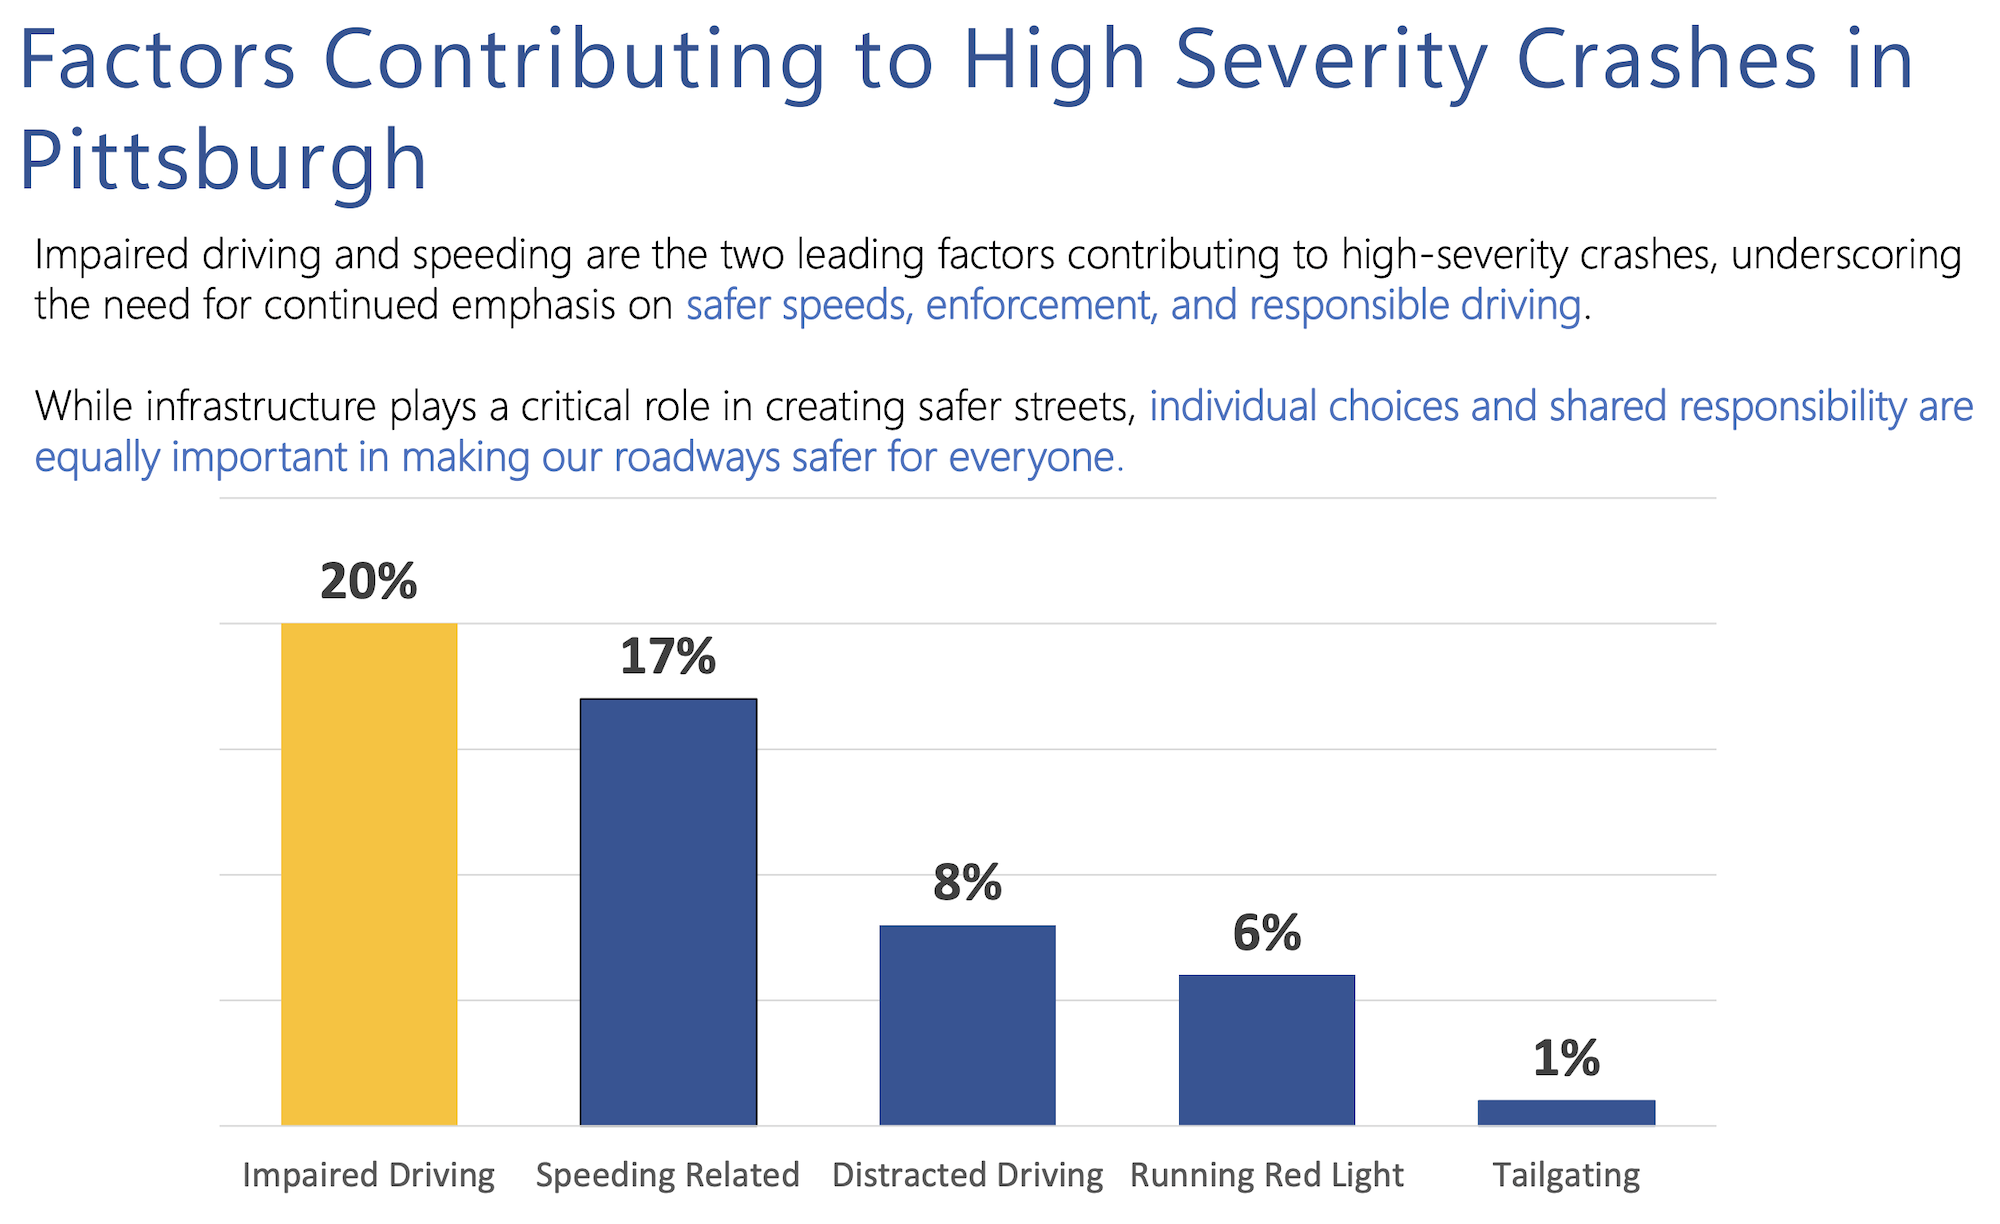
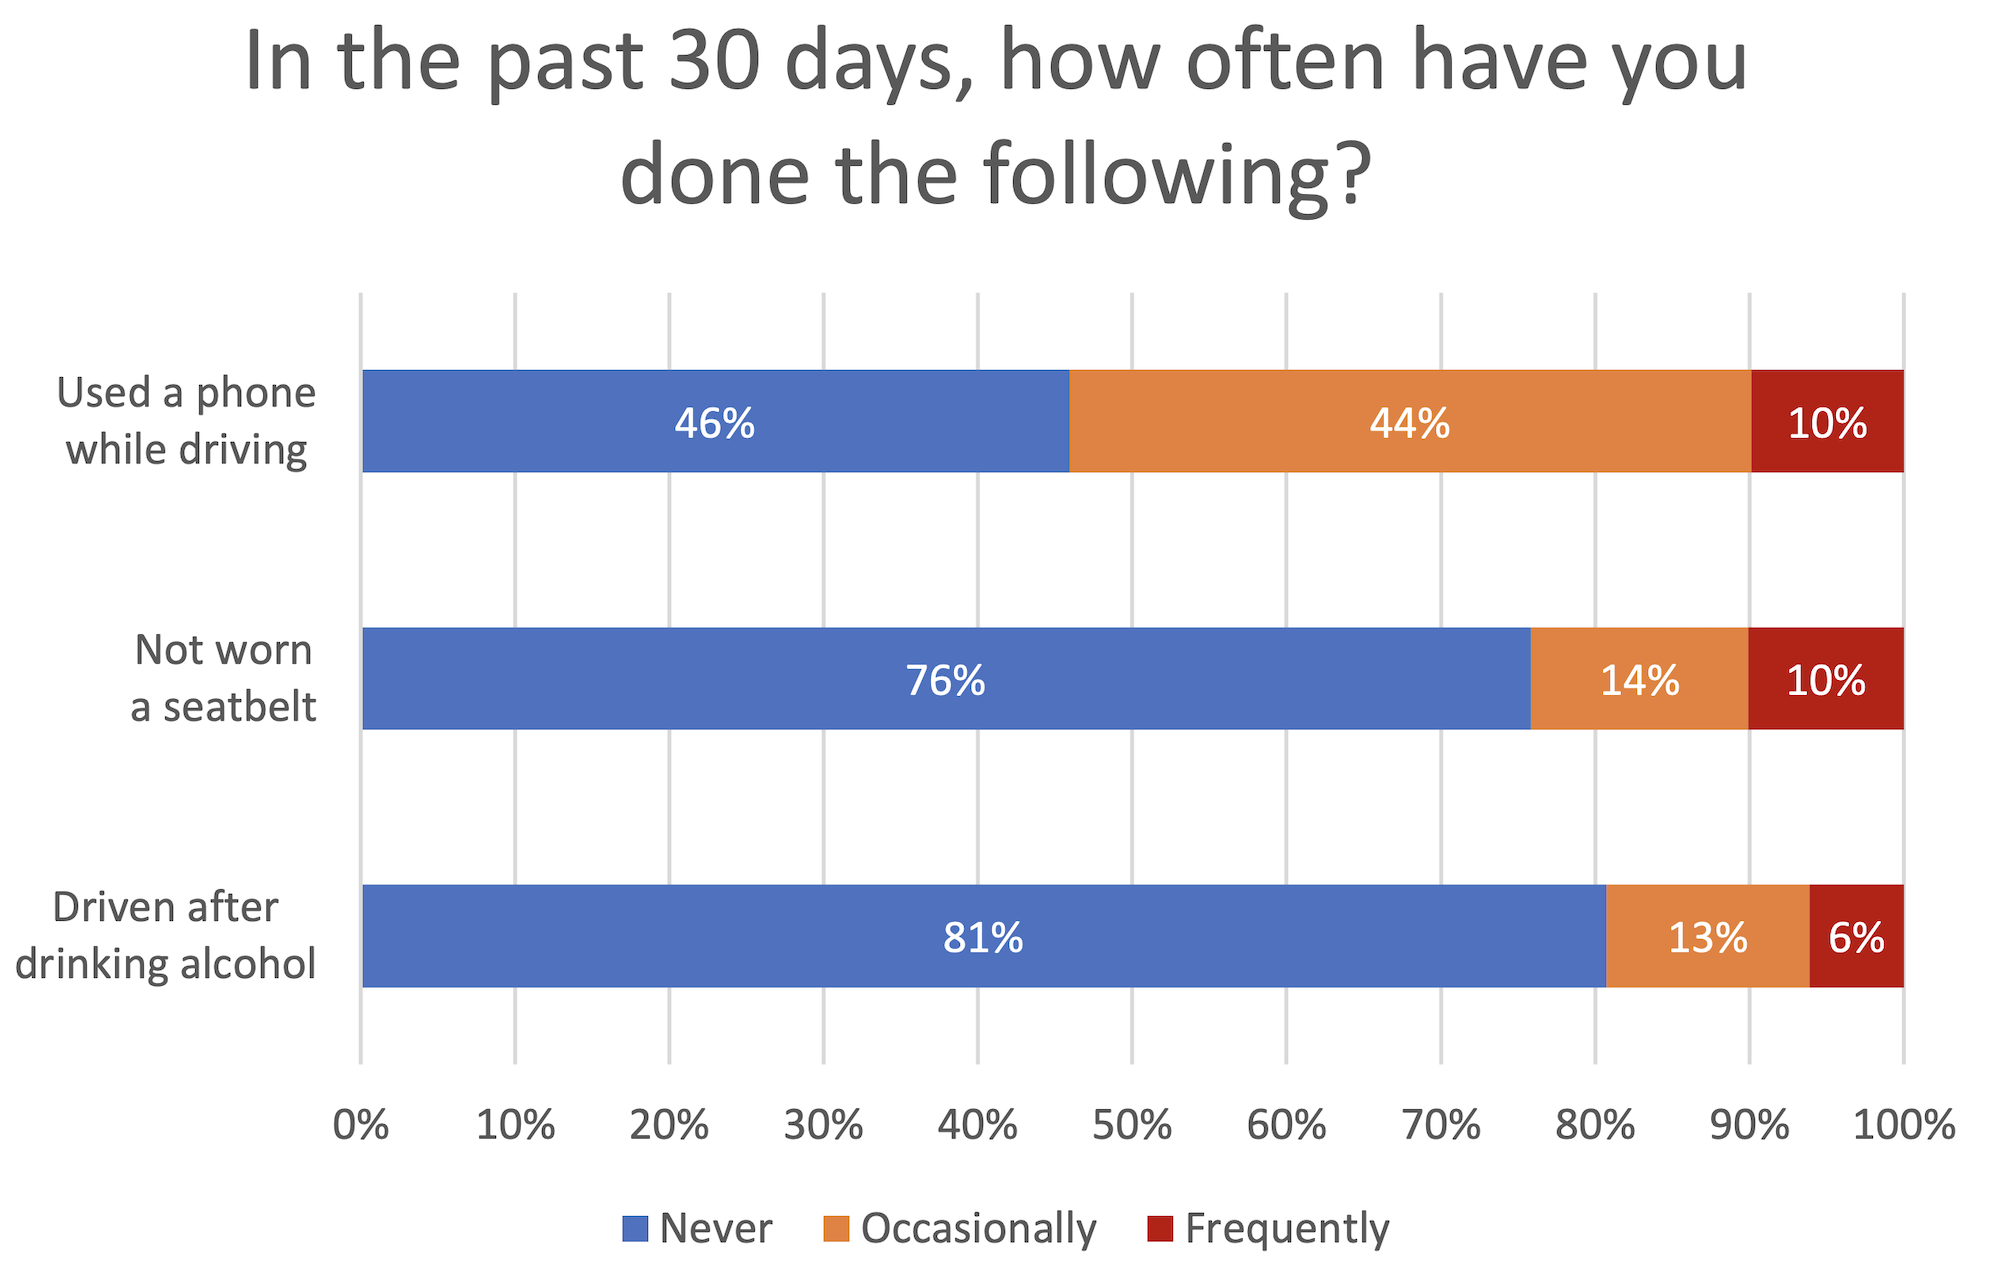
While there’s an overall decline in the total number of crashes, 2025 marked the first time in 5 years that saw an increase in high-severity crashes. Even more perplexing is that these crashes increased the most on city-owned streets, while state-owned streets dropped significantly. An alarming point was how high speeding and driving under the influence were the primary factors of crashes. The saddest part of the survey results showed that, despite being illegal, just how many people still use a phone while driving, still don’t wear a seatbelt, and still drive after drinking alcohol. Something to consider, the next time you see someone on a bike roll a stop sign at a low speed.
On a positive note, the City is reporting a 30% decrease in pedestrian crashes since the Pedestrian Safety Action Plan was approved in 2020.
With all that said, about 33% of the reported fatal crashes in 2025 were vulnerable road users, which is on par with previous years.
#5: WHAT’S NEXT
The report ends with a long list of priority policies and actions to take over the next phase of the City’s Complete Streets and Vision Zero work.
While there’s a lot to look forward to, we are especially excited about the high level goals to expand sidewalk and transit amenity improvements, to institutionalize dedicated bike-lane sweeping, and to better integrate safety into the street paving program.
They also reviewed the action items in the 2020 Bike(+) Plan and Pedestrian Safety Action Plan. The Department’s identified include: to continue to build out bike infrastructure while finding dedicated funding for it, to create a near-miss data collection system, and to create a plan to close all known sidewalk gaps with the goal of completing the whole network in 10 years.
One thing is clear from the report: these improvements don’t happen unless we, as a City, fund Complete Streets projects and ensure that we have the staff to make it happen. As we get close to finalizing next year’s Pittsburgh Capital and Operating Budgets, it’s clear that not only are these improvements popular, but these investments more than pay for themselves with the lives that they save.
 NEWSLETTER