
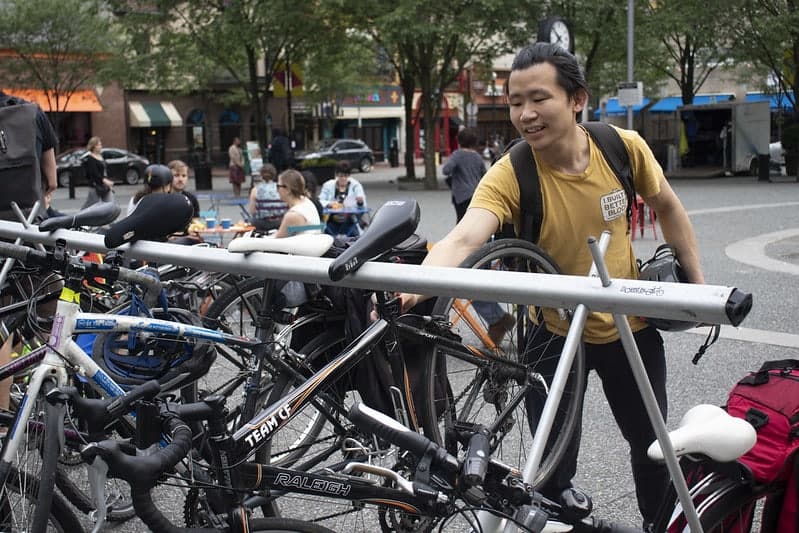
As of Friday, 100% of Pittsburgh buses have bike racks. These increased options help Pittsburgh’s commuters stay car-free
Up 269%, Pittsburgh sees second largest jump in bike commuters out of the largest US cities
The US Census just posted their American Community Survey results for 2010, a survey that we’ve been reporting about for the past few years (2006) (2007) (2008) (2009).
In these posts, we’re specifically looking to find out “what is the primary way that Pittsburgh residents get to their job (wherever that may be)?” And of course, because we love cities, not to mention a bit of friendly competition, we’ve included the largest 60 cities in our analysis. This is not a sample of “how many Pittsburghers ride bikes.” For instance, if you take the bus to your job, but ride a bicycle the rest of the time, you are counted as “transit.” Likewise if you ride a bicycle 3 days and drive 2 days, you are counted as “bicycle.” And if you have no job, are under 16, or are a student, well you’re just not counted. Please see the caveats at the end of this post regarding the ACS data.
Back in 2000, about 0.4% of Pittsburghers chose the bicycle as their primary way to get to work. Today, we’re up to about 1.6% – about the level that Portland, Oregon was 10 years ago. This ranks us as the 13th highest bicycle commuter rate in the nation.
According to the League of American Bicyclists, who has done even more numbers crunching, since 2005, the 38 Bicycle Friendly Communities among the 70 largest cities saw a 95 percent average increase in bicycle commuting. In contrast, the 32 non-Bicycle Friendly Communities (among the largest 70) grew 46 percent. Since 2000, large Bicycle Friendly Communities grew 78 percent, compared to 55 percent for large non-BFCs. The League crunched the numbers for the increase in bike commuting over the past 1, 5 and 10 years.
The League of American Bicyclists awarded Pittsburgh as a “Bronze Bike-Friendly Community” in May of 2010.
Primary means of commuting by mode
Click on the tabs at the bottom of the chart to toggle between modes
Pittsburgh a leader in car-free commuting
Some other exciting news to report are Pittsburgh’s green, aka “car-free” commuting stats rank incredibly well when compared to the other larger cities. When adding biking + walking, we’re in 4th place at about 12.4%, just behind San Francisco, Washington DC, and Boston – the walking capital.
Despite the Port Authority cuts, when adding in transit, we still rank very well, coming in at 7th place in the country.
30.4% – or about a third of Pittsburghers get to their job primarily without using a car.
Car-Free Commuting
Click on the tabs at the bottom of the chart to toggle between modes
We’d have to say that commuting options are very important to Pittsburghers. Our elected and community leaders need to pay attention to these trends. Biking is on the rise, it’s popular, and people just want to feel safer doing it. If we build cycling facilities for everyone from 8 to 80 years old, and not just for the “strong and confident cyclist,” we will get more people biking – much more than the incremental increases we’ve been seeing.
What is the American Community Survey?
The American Community Survey is the country’s largest household survey, reporting its findings every year. With a sample size of about 3 million addresses, this is only an estimate, but is by far the best tool that we have understanding trends in the United States. The survey uses questionnaires and interviews to gather information on demographic, economic, and housing characteristics.
ACS limitations, notes, and cautions
- The ACS asks only about commuting. It does not tell us about bicycling for non-work purposes.
- Results are based on a survey of a sample of the population. Surveys take place throughout the year. The journey to work question asks respondents about the previous week.
- The journey to work question asks about the primary mode of transportation to work. The wording of the question undercounts the actual amount of bike commuting that occurs. It does not count people who rode once or twice a week or people who bike to transit (if the transit leg is longer than the bike leg).
- Since the ACS is a survey of a sample, the results are estimates. The ACS releases a margin of error along with the estimate. Users can add and subtract the margin of error value from the estimate to find the top and bottom of the range within which the ACS is 90 percent confident in their estimate lies. Refer to the 2010 city table for margins of error.
- Changes among years may not be statistically significant.
- The numbers reported here are for the “principal city,” not the larger Metropolitan Statistical Area (MSA).
Mark your calendar for this year’s Day of Giving: Tuesday, October 4
 Never been a member? Need to renew? This is a great opportunity to have your donation matched and go even further! All contributions on Oct. 4 made through PittsburghGives.org will be matched by the Pittsburgh Foundation. PLUS, another generous private foundation will kick in an extra match to DOUBLE your support that day (up to $5000 total) for a bike-friendly Pittsburgh and give you great member benefits for the year!
Visit PittsburghGives.org for more info.