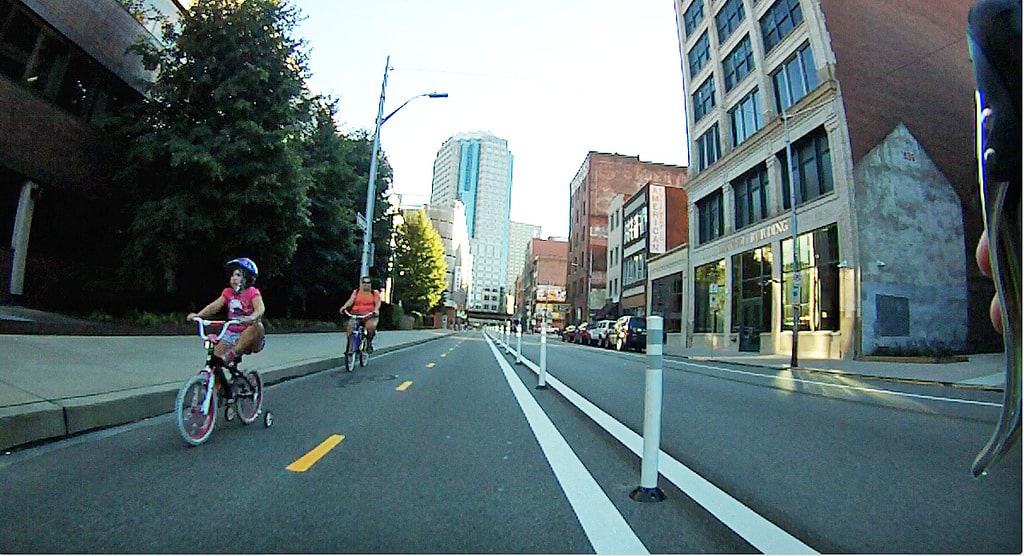
The addition of protected bike lanes on Penn Ave helps build bike commuters from an early age, training wheels and all
Pittsburgh breaks 2 percent and sees a 408% jump in bike commuting since 2000 – largest increase in the nation
Here it is, our annual look at commuting trends in Pittsburgh and beyond. Every September, the US Census posts their American Community Survey (ACS) transportation stats for the previous year.
This is now our eighth year reporting on the data for the 60 largest US cities, and the 2013 results are impressive for biking and walking, to say the least (2006) (2007) (2008) (2009) (2010) (2011) (2012).
The League of American Bicyclists also published a nice analysis of the numbers, showing 62% increase in bicycle commuting nationwide, since 2000. The League plans on following up with more analysis in the coming weeks.
Incredibly, these numbers show a meteoric 408% increase in Pittsburgh bike commuting since 2000, the largest jump of any city in the nation. The latest stats also shows us breaking the 2 percent mark, doubling our 2007 numbers, right around when the City began installing bike lanes in earnest. Our current rate places us in 11th place for rate of bike commuters, just behind Philadelphia. Compare our current 2.2 percent rate to some of the 2006 rates of the most bike friendly cities, and you’ll see a glimpse of what we can accomplish if we continue to invest in safe, convenient, and connected bike infrastructure.
For comparison’s sake, Pittsburgh’s numbers in 2006 were as follows:
- 18th place for bike commuters
- Biking: 0.8
- Walking: 12.4
- Transit: 21.1
- Drove Alone: 53.1
- No car available: 14.7
Our 2013 walking numbers have increased as well, jumping nearly a percentage point from 2012, maintaing our placement as a top 3 walk commuting city. Sadly, transit has dropped significantly (however we’re still in the top 10), which might help explain the increase in walking, biking, and driving alone. People tend to do what’s most convenient for them, and these numbers make it clear that cutting transit makes other modes suddenly more convenient.
With that said, Pittsburgh is still a top 10 green transportation city, if you add up the transit+bike+walk numbers. Adding the walking+biking numbers, places us in 4th place for pedal and foot power transportation, just behind Boston and San Francisco.
Additionally, nearly 11% of Pittsburgh workers have no access to a vehicle (10th most in the nation), so it’s important to continue to invest in transit, biking and walking to make sure these people can get to their job safely and reliably.
With the recent addition of protected bike lanes in our bike infrastructure toolbox, we are confidant that Pittsburgh will continue our upward trend, and “leapfrog” other cities on bicycling and livability indices.
While not perfect, the ACS data is the best data available to help us understand trends in the United States. These stats specifically look at “what is the primary way that Pittsburgh residents get to their job (wherever that may be)?” And of course, because we love cities, not to mention a friendly competition, we’ve included the largest 60 cities in our analysis. This is not a sample of “how many Pittsburghers ride bikes.” For instance, if you take the bus to your job, but ride a bicycle the rest of the time, you are counted as “transit.” Likewise if you ride a bicycle 3 days and drive 2 days, you are counted as “bicycle.” And if you have no job, are under 16, or are a student, well you’re just not counted. Although this is most likely the best data that we have available on this subject, please see the caveats at the end of this post regarding the ACS data.
Primary means of commuting to work
Click on the tabs at the bottom of the chart to toggle between modes
Top 20 Car-Free Commuting Cities
Click on the tabs at the bottom of the chart to toggle between modes
What is the American Community Survey?
The American Community Survey is the country’s largest household survey, reporting its findings every year. With a sample size of about 3 million addresses, this is only an estimate, but is by far the best tool that we have understanding trends in the United States. The survey uses questionnaires and interviews to gather information on demographic, economic, and housing characteristics.
ACS limitations, notes, and cautions
- The ACS asks only about commuting. It does not tell us about bicycling for non-work purposes.
- Results are based on a survey of a sample of the population. Surveys take place throughout the year. The journey to work question asks respondents about the previous week.
- The journey to work question asks about the primary mode of transportation to work. The wording of the question undercounts the actual amount of bike commuting that occurs. It does not count people who rode once or twice a week or people who bike to transit (if the transit leg is longer than the bike leg).
- Since the ACS is a survey of a sample, the results are estimates. The ACS releases a margin of error along with the estimate. Users can add and subtract the margin of error value from the estimate to find the top and bottom of the range within which the ACS is 90 percent confident in their estimate lies. Margins of error are reported on with the data on the ACS site.
- Changes among years may not be statistically significant.
- The numbers reported here are for the “principal city,” not the larger Metropolitan Statistical Area (MSA).
 Not a member of BikePGH? Join today! We need you to add your voice! Bike Pittsburgh works to protect cyclist’s rights and promote the vision of making Pittsburgh a safer and more enjoyable place to live and to ride. For more info, check out: www.bikepgh.org/membership

3 Comments
[…] has seen a 408% bike commuter rate increase since the year 2000 – the largest jump in the nation. The numbers also show a doubling of our bike commuter rate since […]
[…] during a time when reliance on cars is already declining nationwide, Pittsburgh is ranked fourth among cities with commuters who either walk or bike to work (behind San Francisco, Boston, and […]
[…] on the data for the 60 largest US cities (2006) (2007) (2008) (2009) (2010) (2011) (2012) (2013) (2014). As the ACS has some flaws, these numbers should not be taken at face value (see […]