Latest Benchmarking Report offers a comparative analysis of US Cities and States and how well their biking and walking programs perform
With the help of the Centers for Disease Control, the Alliance for Biking and Walking publishes the biennial Benchmarking Report to collect and analyze data on bicycling and walking in all 50 states and the 51 largest U.S. cities. The Report combines original research with government data sources to compile info on bicycling and walking levels and demographics, safety, funding, policies, infrastructure, education, public health indicators, and economic impacts. It’s an essential go-to resource for public officials, advocates, decision makers, and researchers.
While Pittsburgh is technically not one of the largest 50 cities in the country, we are added in as “additional” cities of the small and mid-size variety. The other cities in our population cohort are Anchorage, Baton Rouge, Madison, Spokane, and St Louis. The first time that we were included in this study was in 2014.
For easy reference, below are some choice highlights from the report, at least where Pittsburgh data is involved. It’s worth mentioning that many of the stats in the report are taken directly from the US Census’ American Community Survey (ACS), something that we have been reporting on for nearly a decade. The ACS data looks specifically at how people who live in the City of Pittsburgh get to their job, and does not count the total number of bikers, walkers, transit users, or drivers, for that matter.
The full 2016 Benchmarking report contains of wealth of information that we obviously couldn’t include in this post, so please go and download it for free or order yourself a hard copy.
Infrastructure
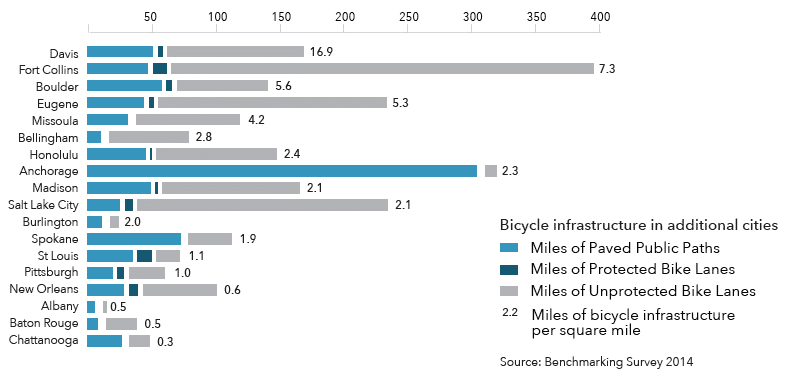
Here’s a visual comparing small and mid-sized cities, and the total miles of bike lanes and paved trails, ordered by miles of bicycle infrastructure per square mile. It goes without saying that the higher a city is on this list, the more “normalized” bicycling will feel as residents are more accustomed to seeing bike lanes.

Here’s another way to look at bike infrastructure. Pittsburgh lies well below the average and median for miles of bike lanes and paved paths. On the bright side, we are leading the charge in miles of sidewalks (total and per square mile), which helps us understand why we have some of the highest rates of workers walking to their job.
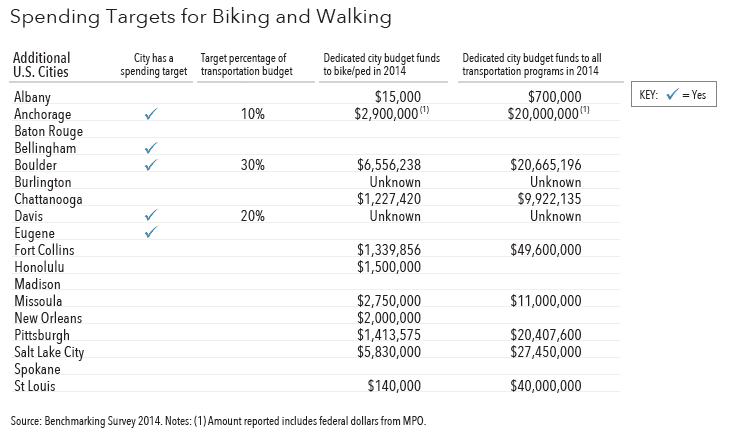
Here is where the paint meets the pavement. Pittsburgh has significantly increased the dedicated city budget to bike/ped over the past few years, but other cities have been at our level or higher for more time, partly explaining why we’re playing catch up in miles of bike lanes.
Fatalities
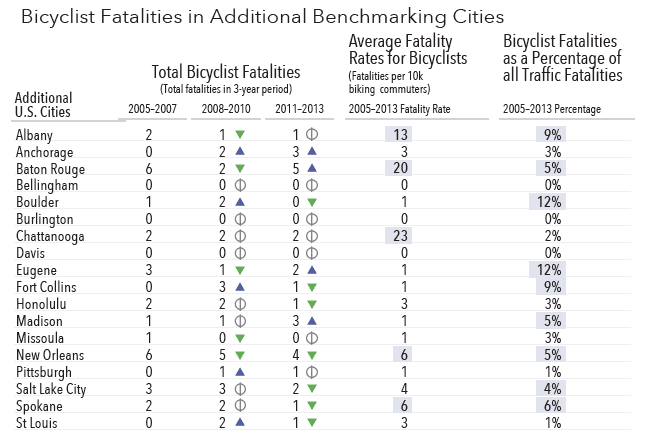
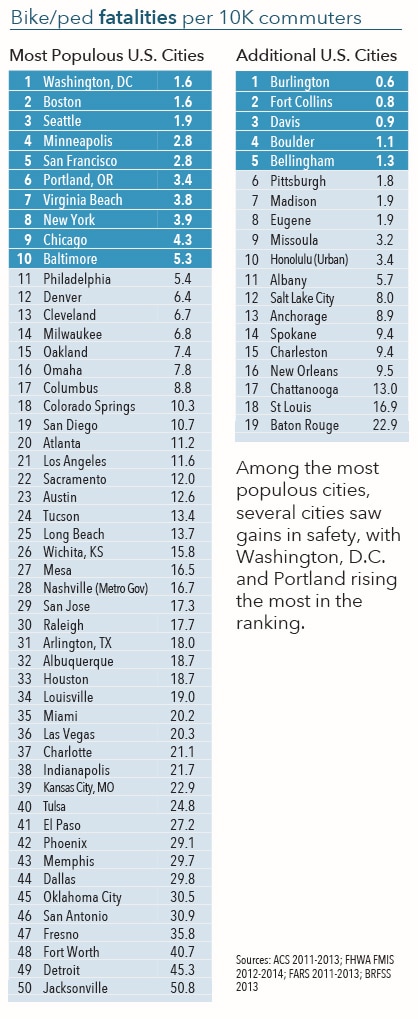
Fortunately, the fatality rates for Pittsburgh bicyclists is comparatively low, although we clearly have work to do.

Despite our large number of sidewalks, a full quarter of all of Pittsburgh’s traffic fatalities are pedestrians.
Demographics
Demographics
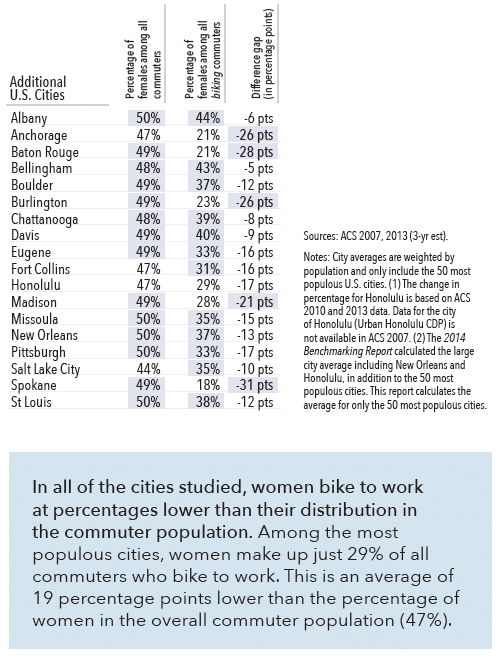
Some stats regarding the numbers of women who commute by bike. This metric is often considered an indicator on a city’s bike-friendliness.
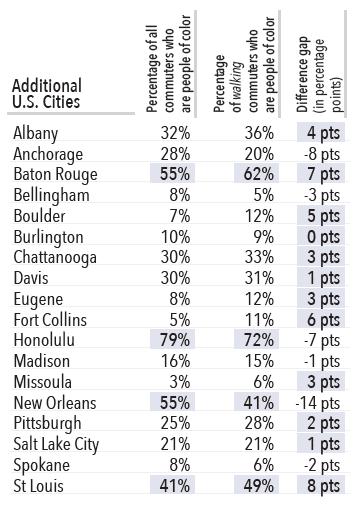
Chart showing the rates of walking commuters among people of color.
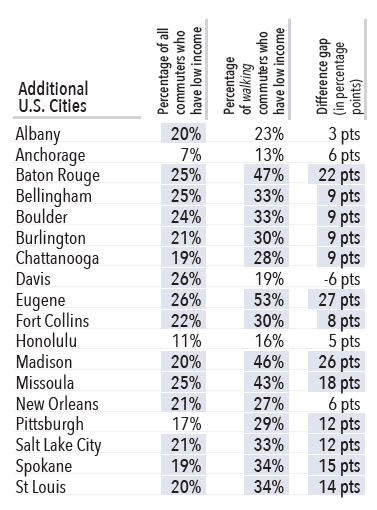
This chart brings to light the equity issue of why investing in quality pedestrian infrastructure is important to commuters with a low income. Often, these communities are dependent on their sidewalks and steps, yet may see less care and investment in these very same amenities in their neighborhoods.
Health Outcomes
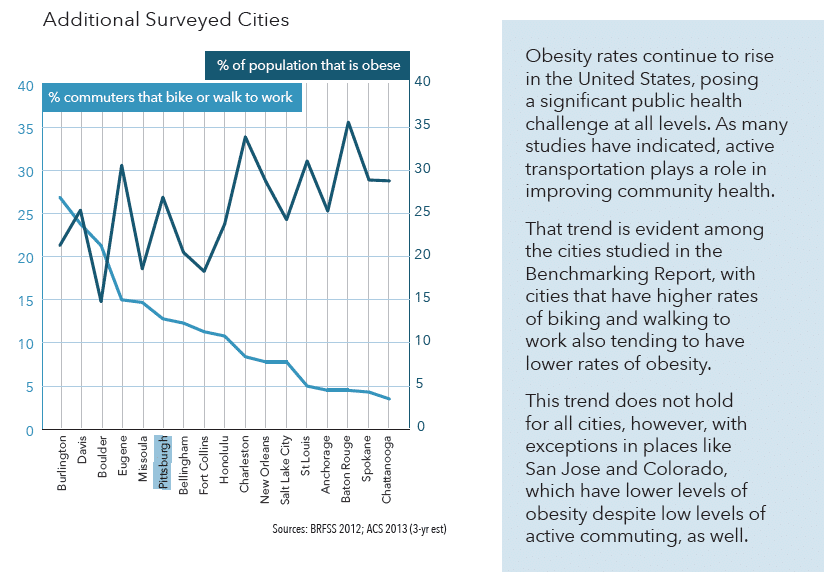
One of the things that the Benchmarking report excels at is making the connection between quality biking and walking facilities, and better health outcomes.
Sign up for Bike Pittsburgh’s newsletter, The Messenger, to get the latest news on events, bike and pedestrian infrastructure, and fun, delivered straight to your inbox. Twice monthly emails, no spam.