
Putting people first will reduce crashes and save lives
In honor of World Day of Remembrance for Road Traffic Victims, we are releasing our Report on Pedestrian and Bicycling Safety in Pittsburgh, 2011-2015.
Why we created this report
At the heart of Bike Pittsburgh’s mission is safety. In fact, our origin in 2002, in part, is due to a hit-and-run driver crashing into one of our cofounders.
While just about everyone can agree things have gotten better since 2002, most evidence suggesting so is anecdotal. Constantly we hear from people who don’t ride because they don’t feel safe due to the lack of safe, comfortable, connected bikeways, and aggressive or even hostile drivers. These stories, while useful, don’t help us get to heart of the matter at hand.
How dangerous is it really for people on bikes and foot in Pittsburgh?
Until now, this is a question that nobody could answer with facts. City Planning didn’t know, PennDOT didn’t know, the police didn’t know. The lack of data has made it difficult to make the case as to why we even need bike lanes, traffic calming, and Complete Streets policies.
Recently, Allegheny County, in cooperation with Western Pennsylvania Regional Data Center (WPRDC), released to the public, a decade’s worth of crash data. While the information has always been available, the public’s access to the information from PennDOT’s database was limited.
This report is intended for urban planners, traffic engineers, law enforcement officials, elected officials, and neighborhood advocates in order to better understand how our streets are performing and serving our safety needs. The data can be used to strategically allocate limited resources using the tools of engineering, education, and enforcement in order to fix problem areas and ultimately reduce harm.
We hope that this snapshot of the state of biking and walking safety in Pittsburgh will help us realize what type of improvements are needed. We aim to update this report as new data become available in order to create a public record that we can use to track our progress toward the ultimate (and achievable) goal of zero deaths from traffic crashes in Pittsburgh.
Making people count by counting people
While an accurate count of people walking and biking is particularly difficult to obtain, we do have some tools to help us get a sense of how we compare to other US cities.
Related: See our latest post about Pittsburgh’s commuting stats based on the US Census’ American Community Survey data.
General Crash Stats: Driving, walking, and biking
 A pedestrian is hit every 34 hours in Pittsburgh. A bicyclist is involved in a crash every 6 days.
Roughly 6% of all crashes involve people walking and about 2% involve people on bikes, however, pedestrians and bicyclists take the brunt of serious injuries and fatalities.
Related: Code for Pittsburgh’s Allegheny County Crash Map, 2004-2015
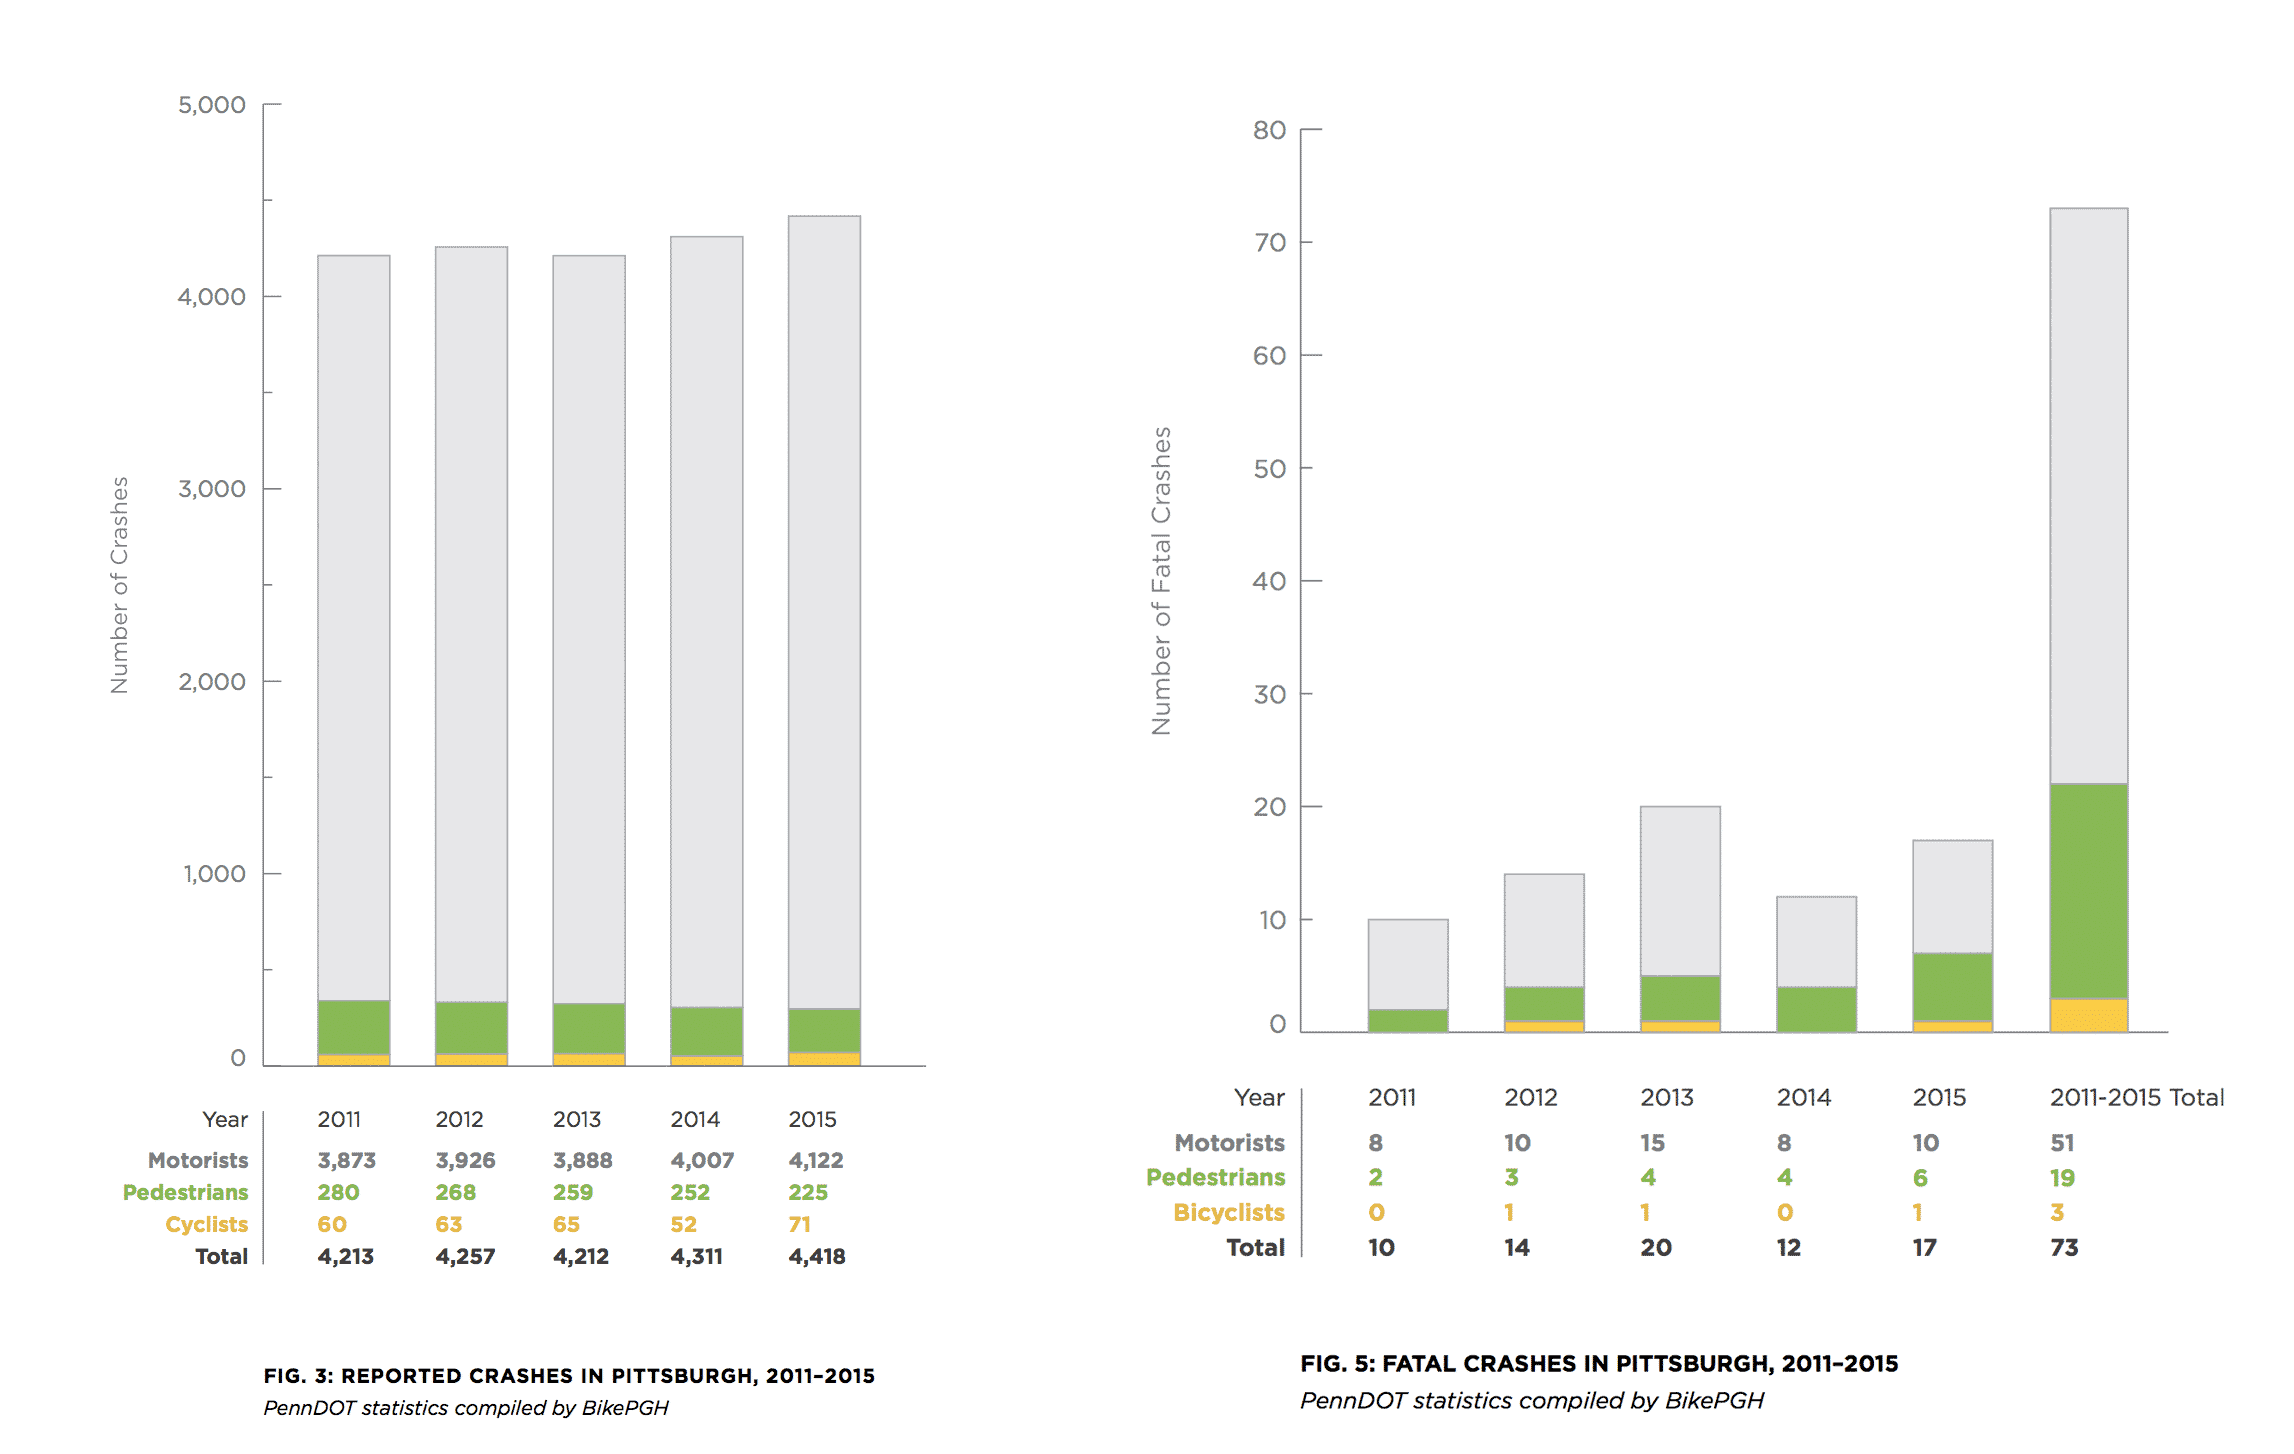
Fatal Crashes
In total, there were 79 deadly crashes between 2010 and 2014 on Pittsburgh’s streets, resulting in the loss of 84 lives.
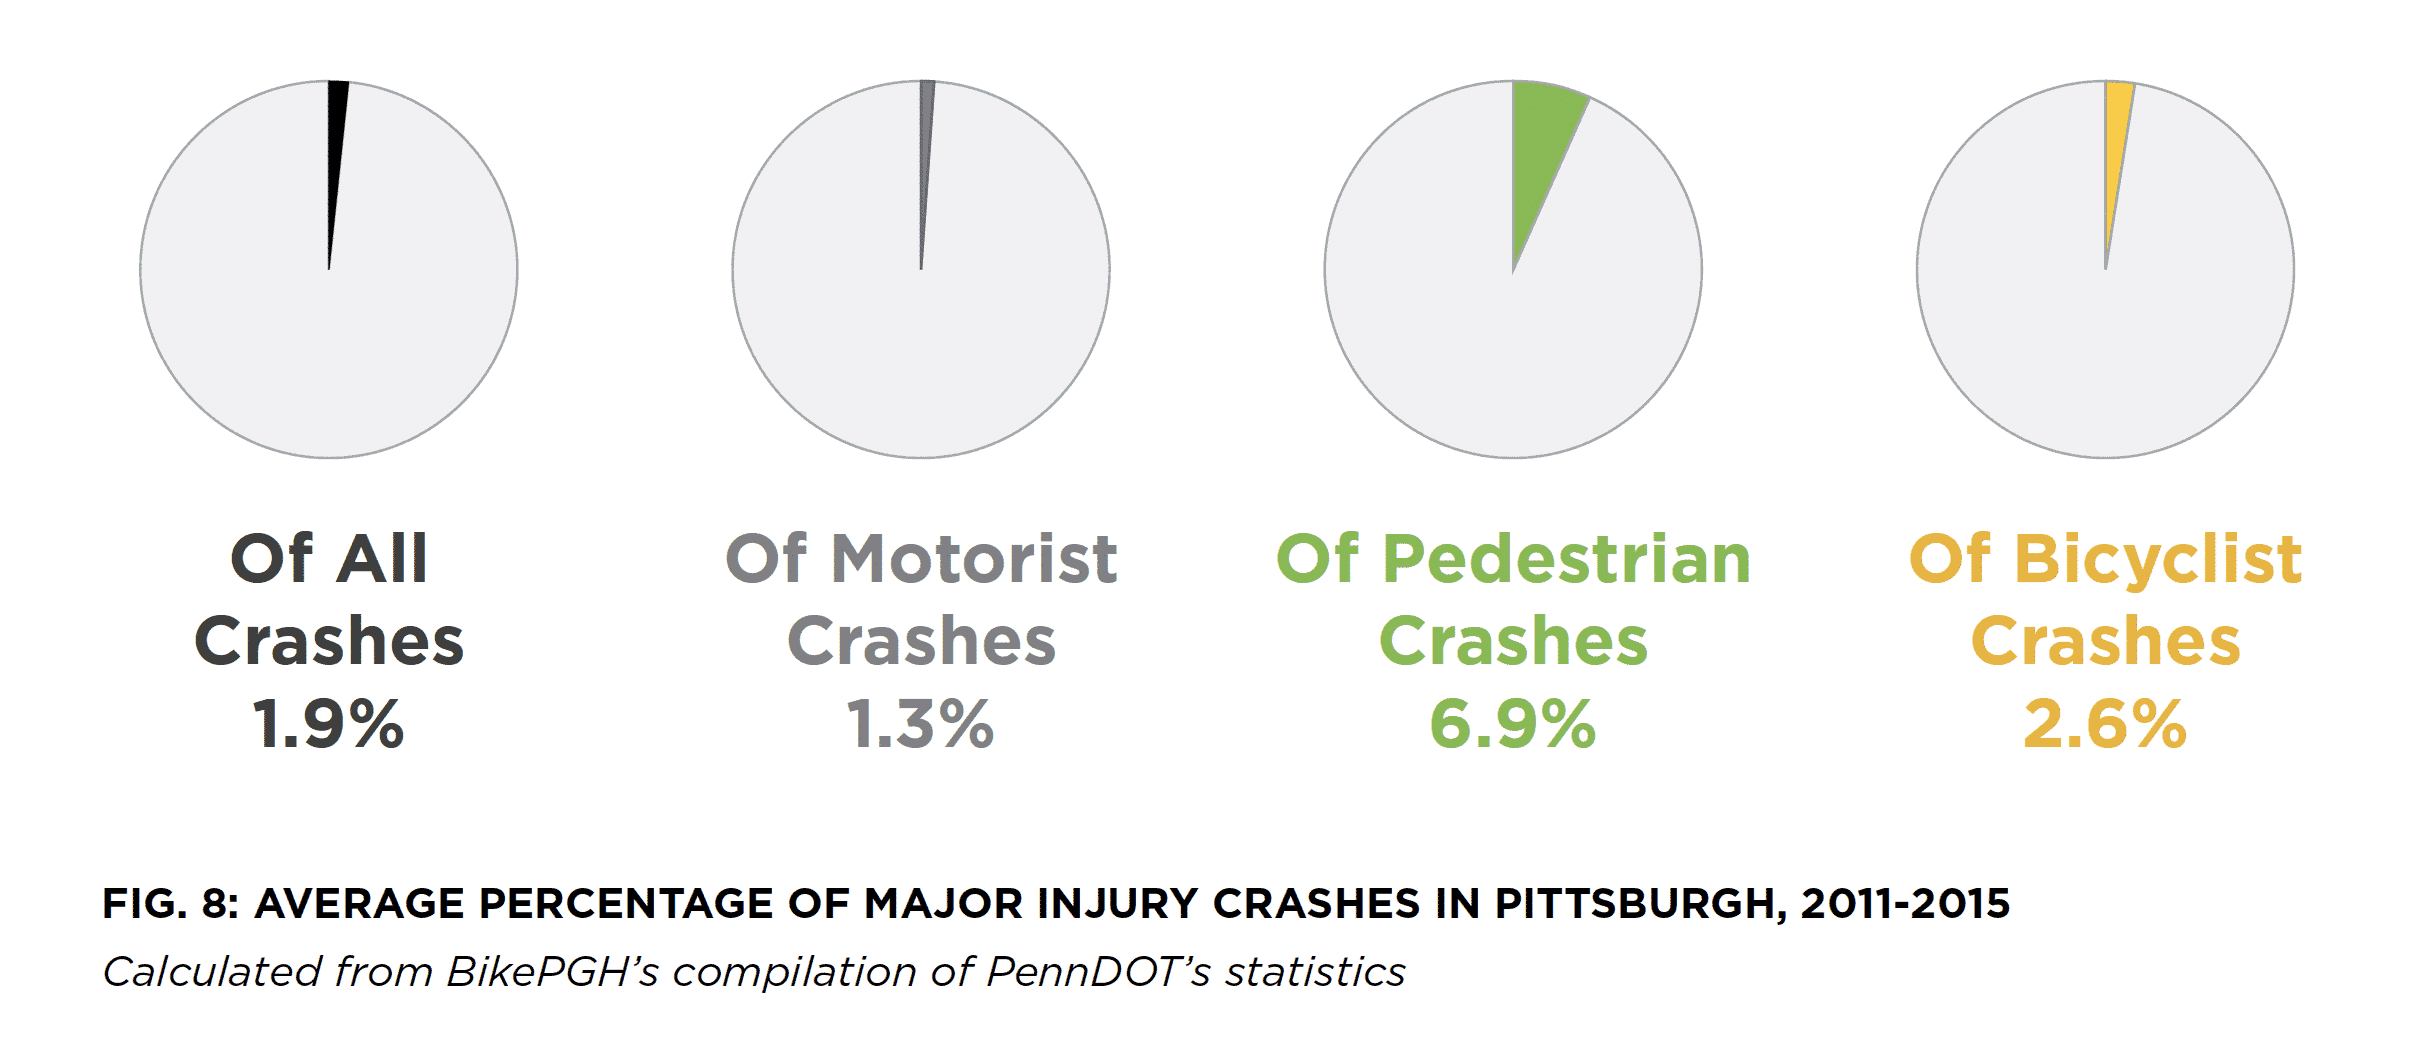
Pedestrians and bicyclists are killed at a higher rate than auto drivers, and account for a large share of all fatal crashes. While only 6% of all traffic crashes involved pedestrians, they accounted for a stunning 26% of Pittsburgh’s traffic fatalities from 2011-2015.
Injuries
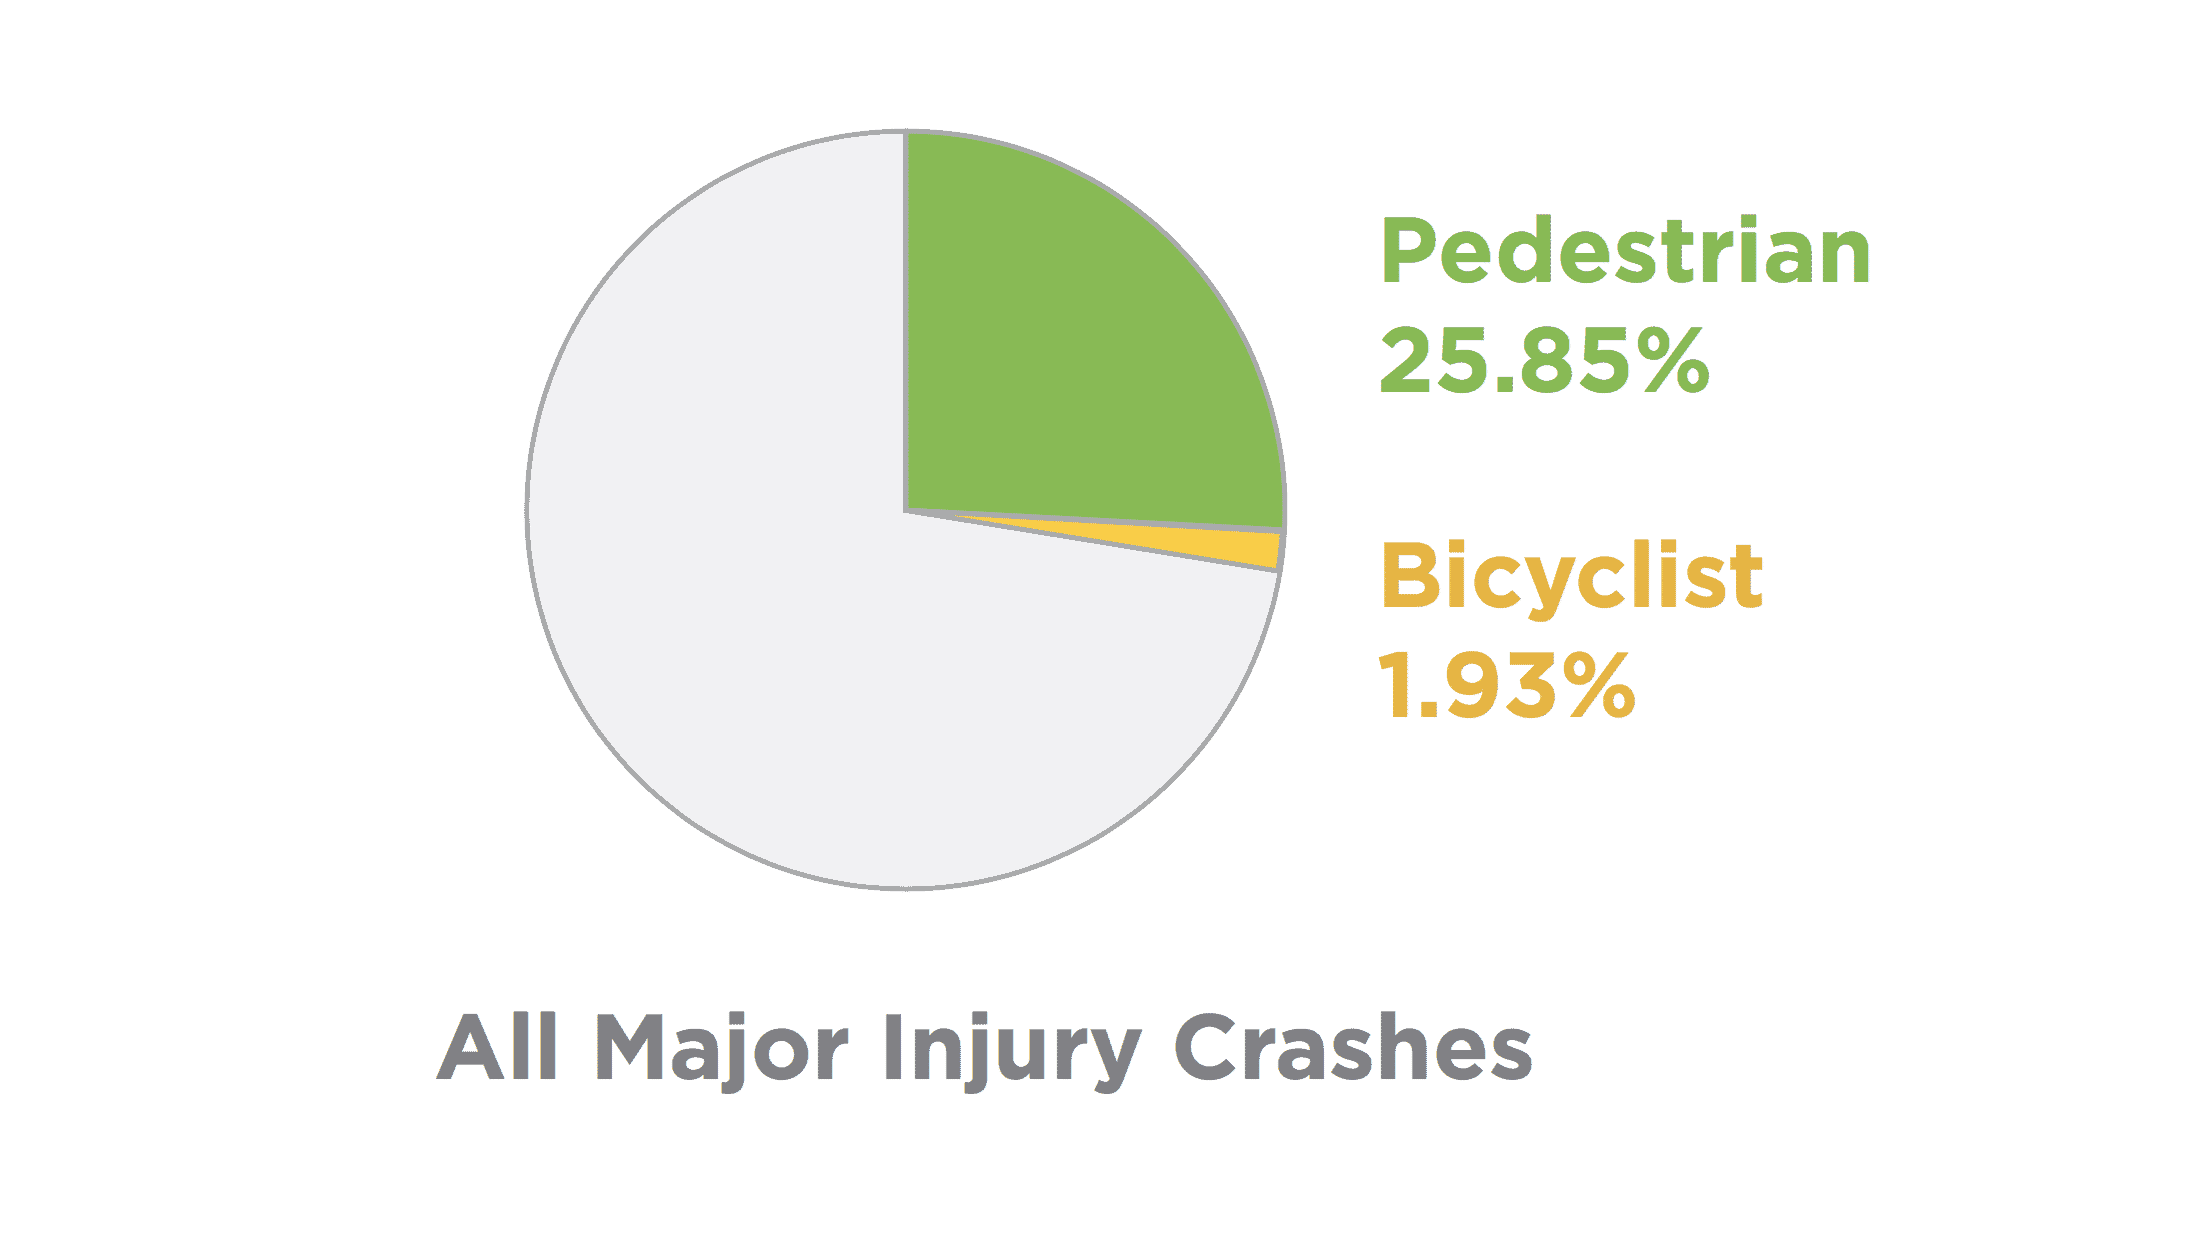 On average, between 2011 and 2015, an average of 69 crashes per year left someone with a major injury, 28% of which are bicyclists and pedestrians.
In many cases these people have sustained life-altering injuries.
Context and Comparisons
In the report you can see how Pittsburgh’s safety ranks when compared to the State of Pennsylvania and Allegheny County.
We also compared Allegheny County to other similar cities, like Cleveland, Buffalo, Cincinnati, Honolulu, Louisville, and Milwaukee.
During our research, one thing became clear: very few cities or counties have compiled these basic statistics for the public to view. Finding comparable data was not as simple as we had anticipated.
Takeaways
 We understand that there are few surprising revelations in this report. However, it’s important that politicians, advocates, and decision makers have a baseline of what is going on in order to make intelligent arguments and develop reasoned responses.
If there’s one big takeaway from this report is that we need to put pedestrians first when it comes to street safety. All trips begin and end as a pedestrian.
Pedestrians and bicyclists bear a higher burden of major injury or death. Compounding the problem is a widespread under-reporting of pedestrian and bicycle crashes, an issue the report goes into at length.
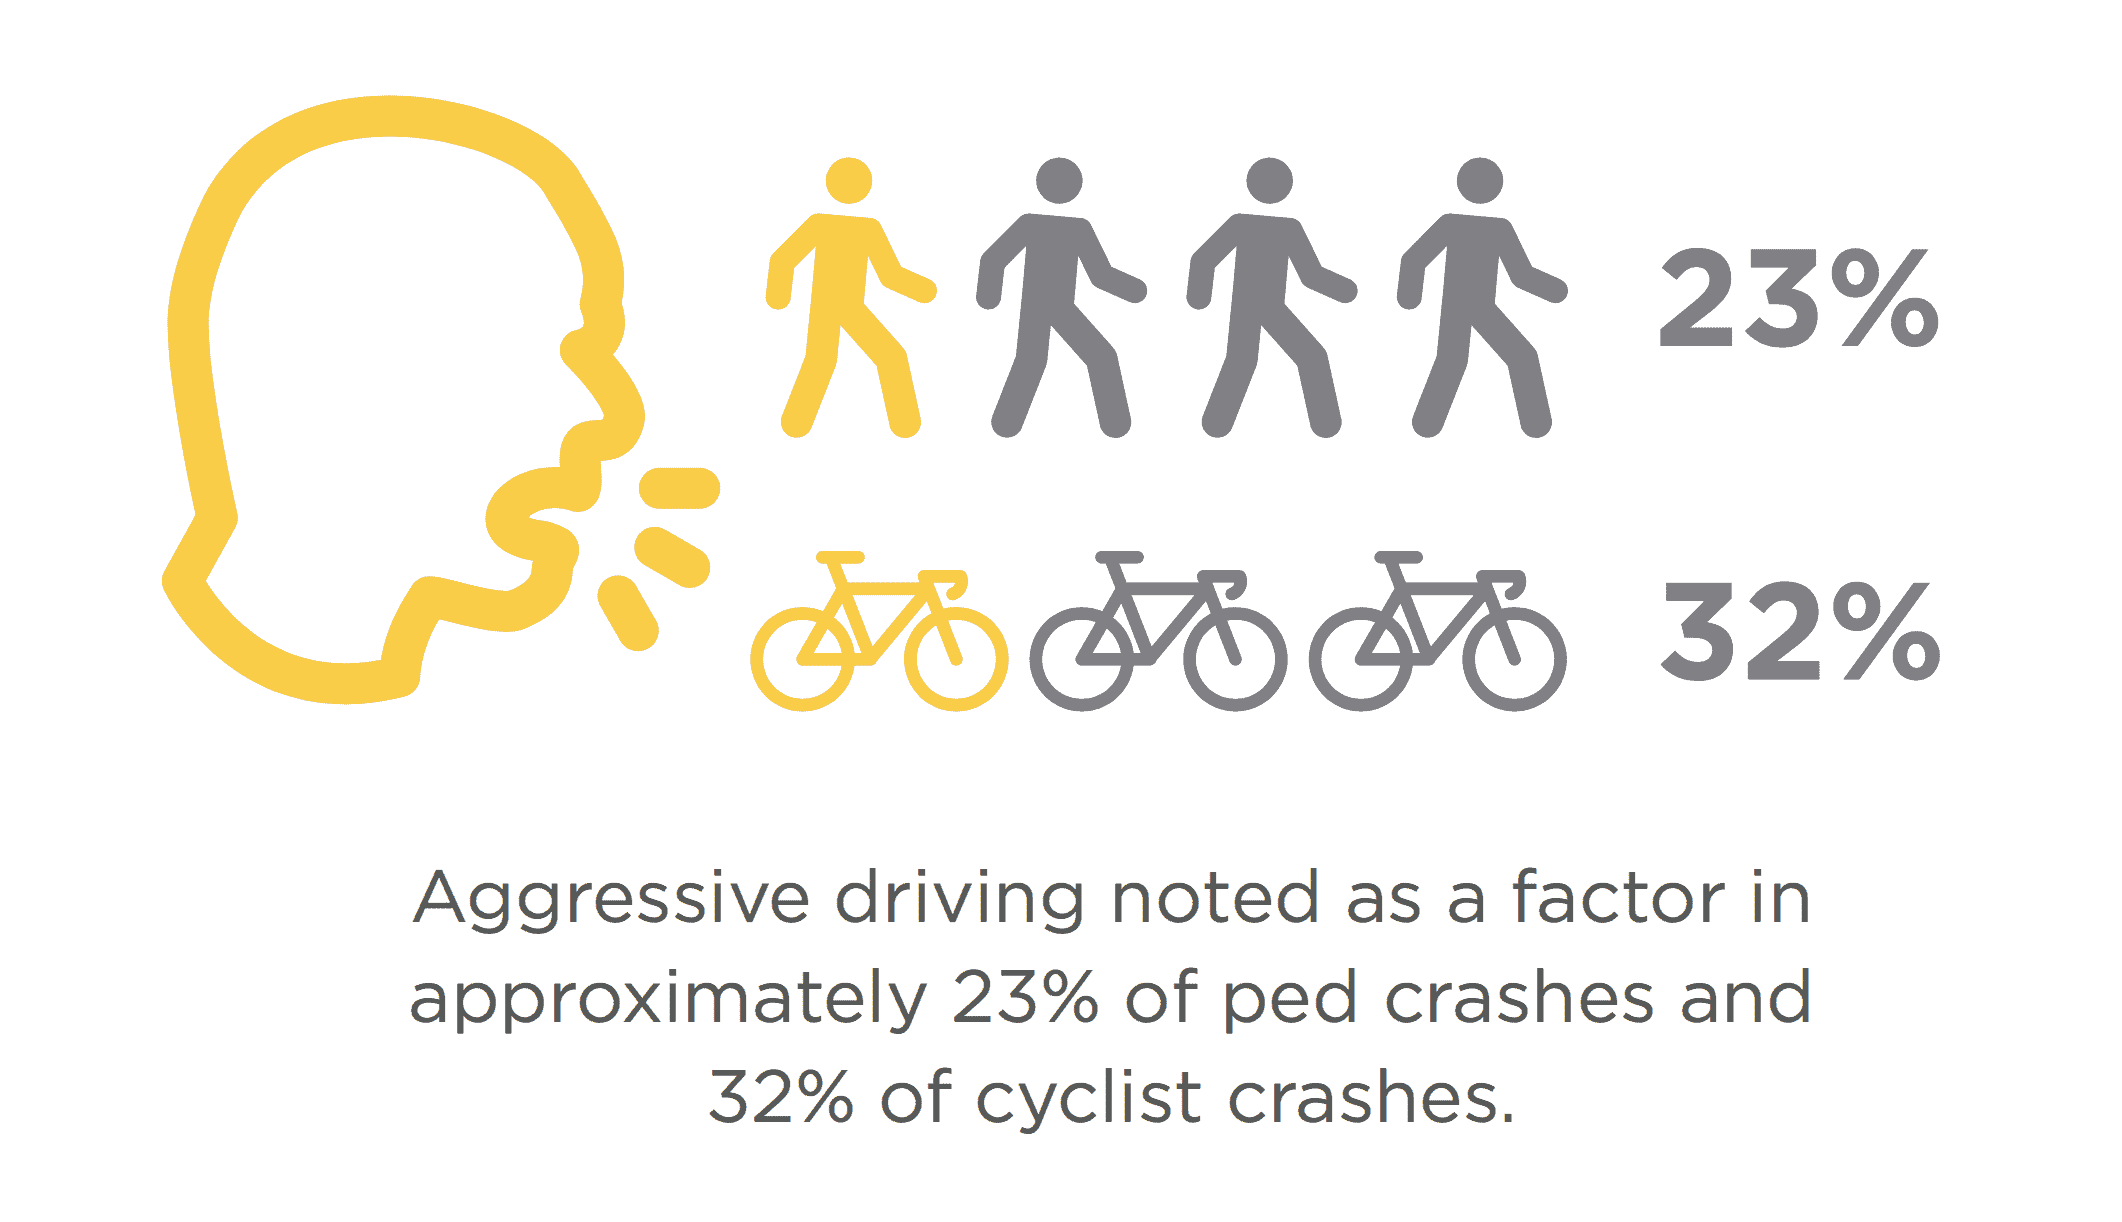
The data shows that conditions leading to the majority of pedestrian and bicyclist crashes are not caused by pedestrians or bicyclists.
We reached another clear conclusion that while overall traffic fatalities are declining, pedestrian fatalities have not kept pace. Pedestrians, as a percentage of traffic fatalities, has been increasing in Pittsburgh, the State of Pennsylvania, as well as in benchmark cities. This is unacceptable.
By targeting investment and safety improvements towards the approximately 300 pedestrian and bicycle crashes that occur each year, major injuries and traffic fatalities can be significantly reduced, if not eliminated.
Making ongoing investments in improving pedestrian and cycling infrastructure, especially within the city of Pittsburgh, will have a large effect on improving road safety for all, and will move us towards reaching the goal of zero traffic fatalities.
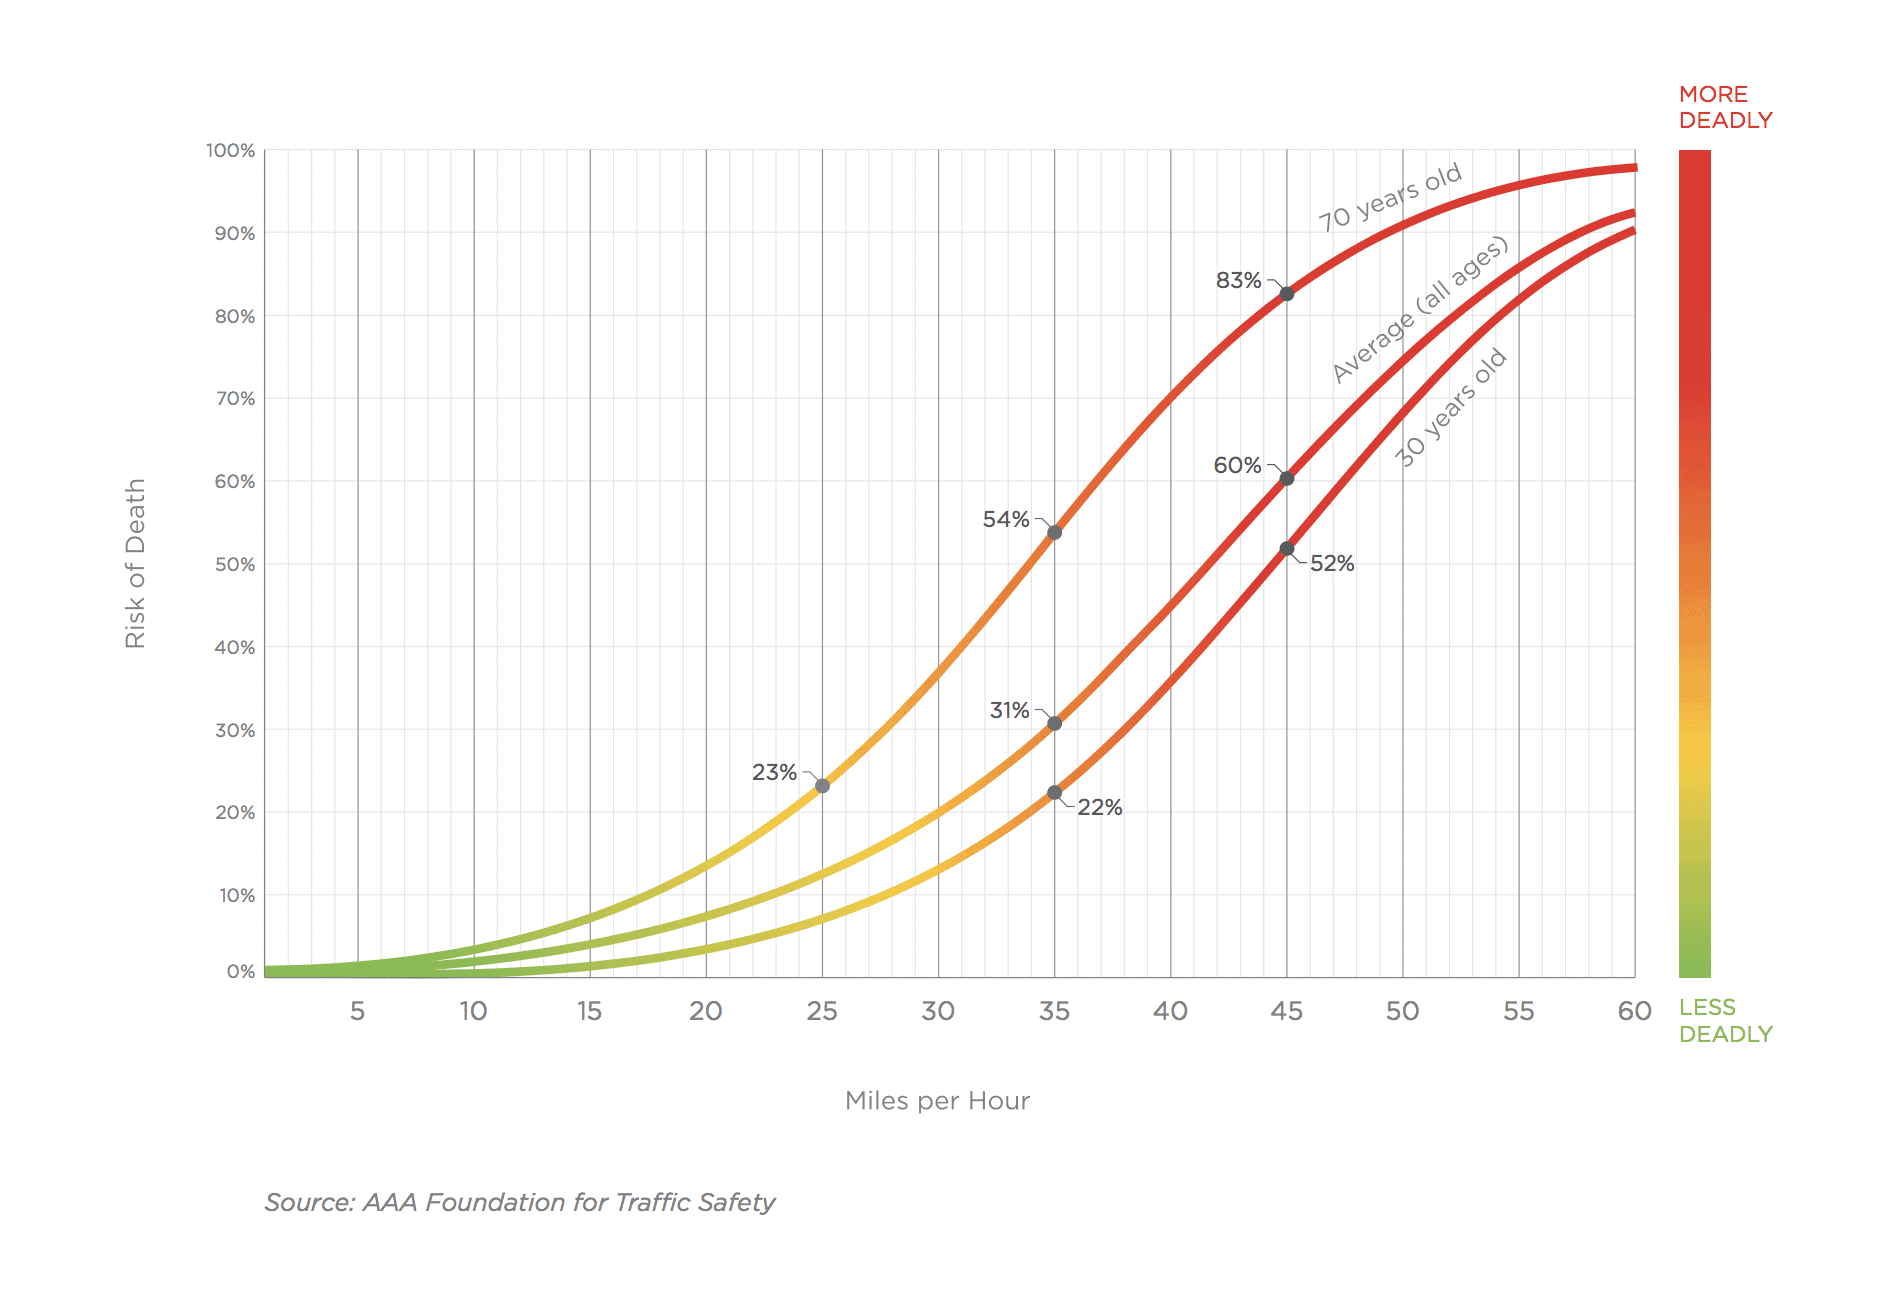
Better crosswalks, protected bike lanes, and reducing automobile travel speeds will go a long way in reducing the burden of injury for Pittsburgh’s cyclists and pedestrians, the most vulnerable users on our roadways.
This is just a first step. We look forward to seeing what our partners will find when digging deeper into these stats.
Download the full report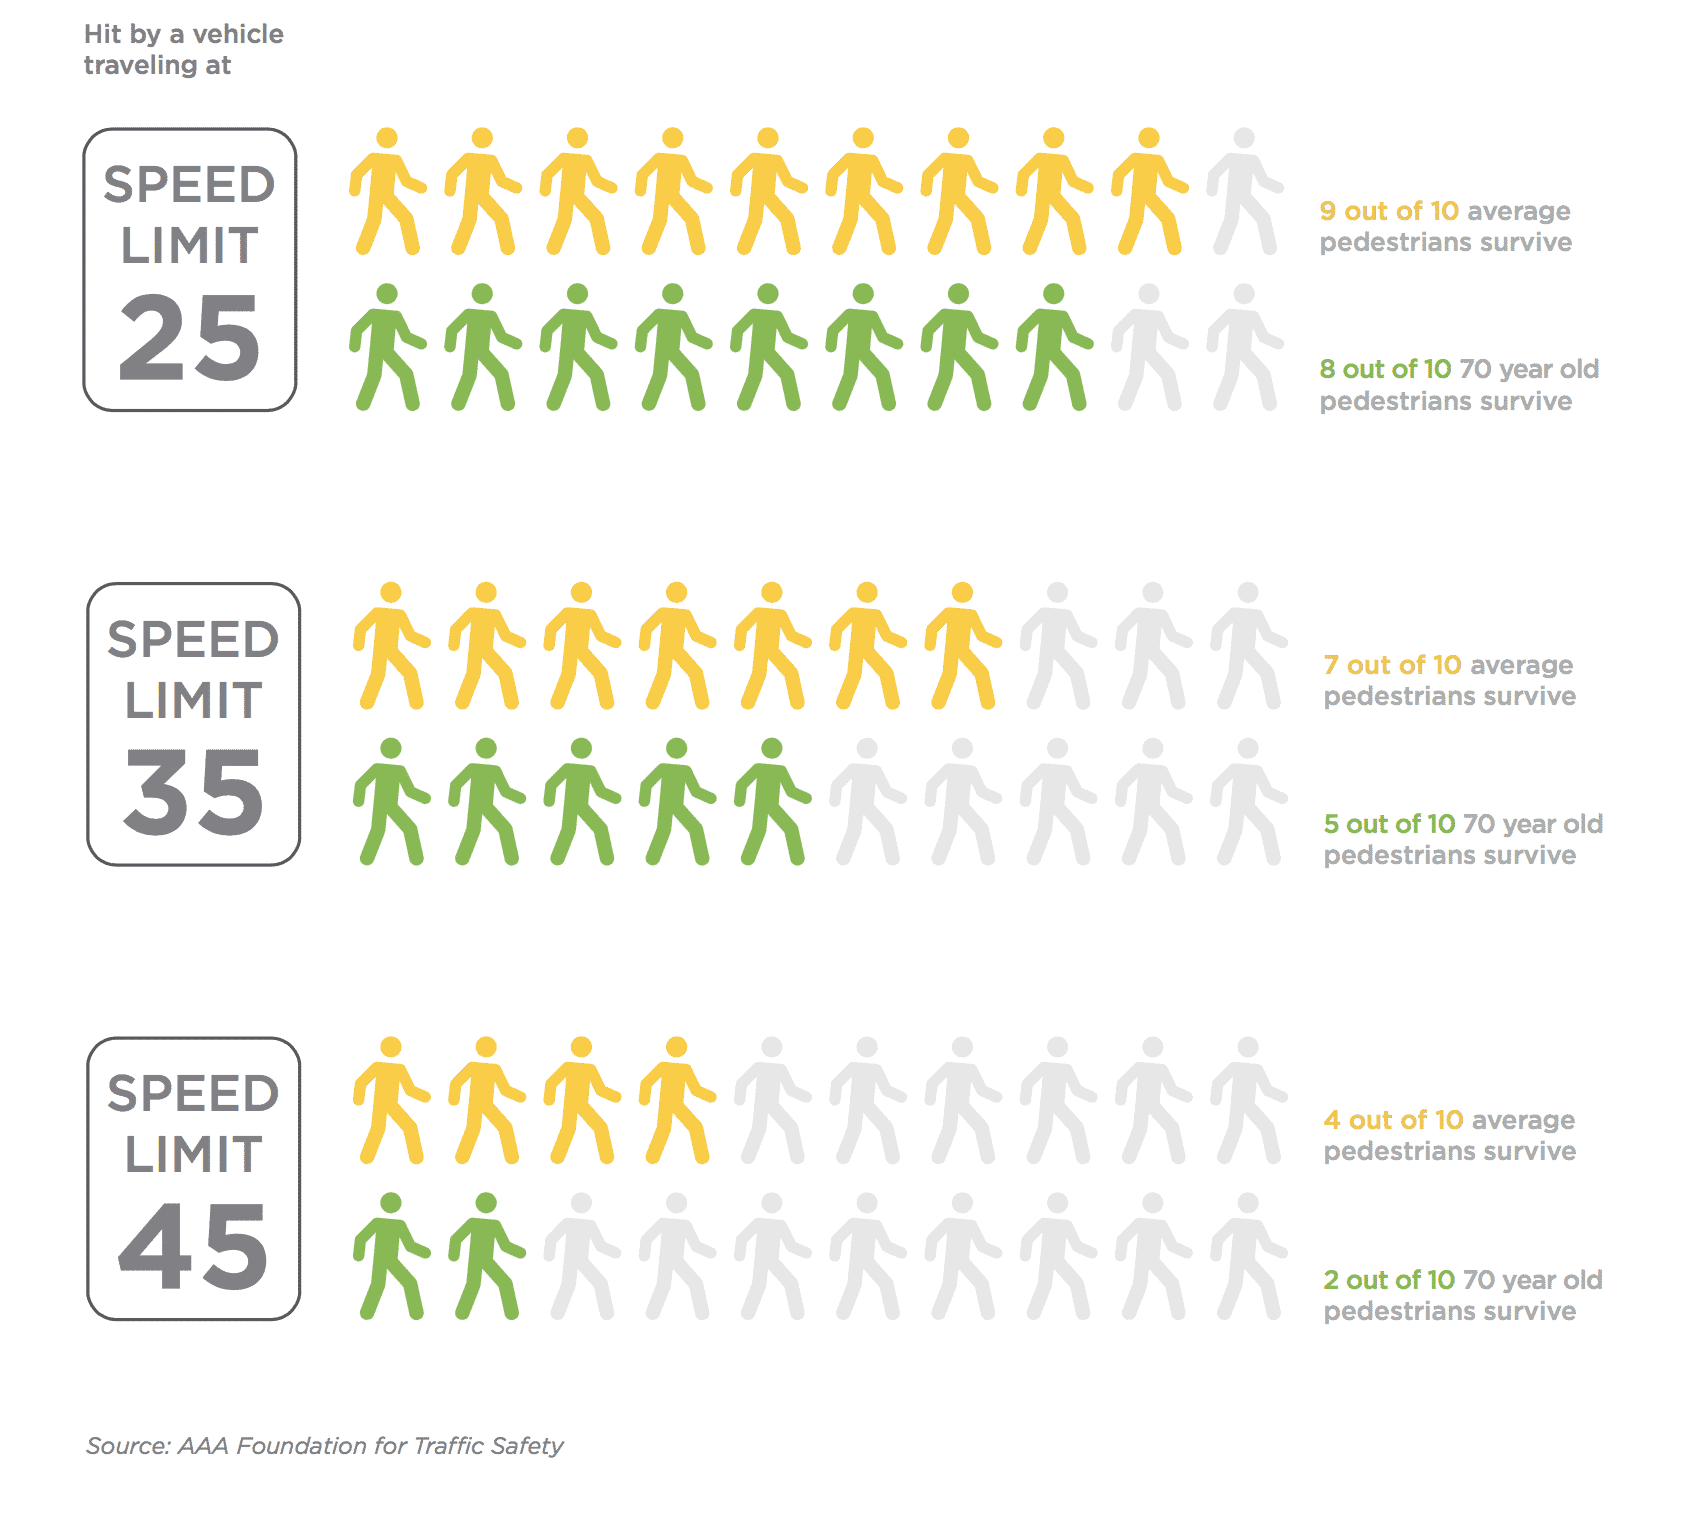
Bicycle Crash Map (2004-2015)
Click through to view selected data regarding bicycle crashes in Pittsburgh.
Click here to open full screen Bicycle Crash Map
7 Comments
[…] out the inherent sprawl-supporting value judgments that feed arguments for new road funding. And Bike PGH shares details from a new study exploring the risks faced by pedestrians and cyclists in the Steel […]
[…] Read our report […]
[…] out the inherent sprawl-supporting value judgments that feed arguments for new road funding. And Bike PGH shares details from a new study exploring the risks faced by pedestrians and cyclists in the Steel […]
[…] A decade-long study by Allegheny County, in collaboration with the Western Pennsylvania Regional Data Center, found that a cyclist is involved in a crash around every six days in Pittsburgh. […]
[…] Continue Reading… […]
[…] recently published a detailed Report on Pedestrian and Bicycling Safety in Pittsburgh. This report found that pedestrians and bicyclists are killed at a higher rate than auto drivers, and […]
[…] becomes more accessible by bike and by walking, more and more safety concerns are being raised. Bike Pgh’s report on Pedestrian and Bicycle Safety found that, on average, pedestrian is hit every 34 hours in Pittsburgh. Furthermore, a bicyclist […]