
OpenStreetsPGH on the West End Bridge
If you fund biking and transit, you get people biking and using transit
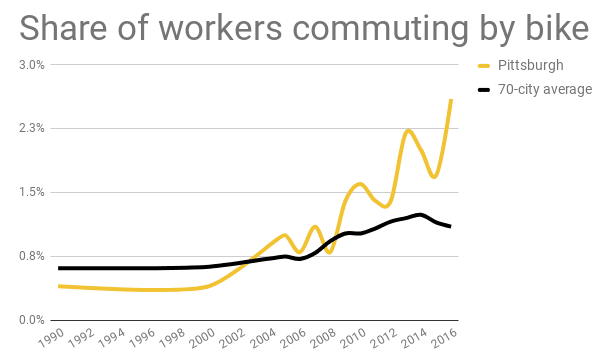
Pittsburgh has bucked the nationwide trend, and has posted a significant increase in our bike commuter rate, despite cheaper gas prices, according to the latest US Census data for 2016. Additionally, we’ve posted a significant gain in public transit riders, after a five year downward slide.
The American Community Survey tracks what the primary way that American commuters get to their job. Put simply, we are specifically tracking the percent of workers, who live within the City of Pittsburgh, and how they get to their job, wherever that may be.
Pittsburgh Joins top ten cities for bike commuting (out of largest 60 cities)
 So what’s going right?
Both bicycling and transit can claim a dedicated source of funding over the past few years. For bicycling, federal, state and local sources had been investing more than ever in making it safer to bike. For instance, since the City began installing bike lanes in 2007, Pittsburgh has more than doubled its bicycle commuter rate. According to numbers crunched by the League of American Bicyclists, since 2000, we’ve seen a 485% growth in bike commuting, the second largest growth in the nation. Since 2011, we’ve grown by 85%, also one of the largest jumps for this time period. For transit, dedicated funding from the state has allowed the Port Authority to reinstate some routes that were previously cut and improve service.
This year’s ACS numbers come in the heat of a battle about the Republican proposal to raid state public transit and multimodal funds to balance the state budget. Even PennDOT has pointed out the irresponsibility of this proposal. As the yearly charade surrounding the state budget heats up, gutting these very funds will have have a profound impact on Allegheny County, and would devastate the Port Authority, who could lose millions. The proposal seeks to undermine the ACT 89 transportation and infrastructure bill that state legislators agreed upon just four years ago, signed by former Governor Tom Corbett (R).
Gutting these funds will also gut the momentum that has proven to help Pennsylvanians in real ways. People can remain more independent, save money, and improve health and air quality. Biking, walking and transit are inexpensive when compared to car ownership and provide multiple benefits, which ends up saving the state’s limited cash. These modes remain the most affordable ways to get around, so raiding these funds mean taking real money from the pockets of working Pennsylvanians.
Before you read the rest of this article, please take a moment to reach out to your State Representatives and Senators and tell them to protect multimodal and dedicated transit funds.
Let them know it is unacceptable to raid funds meant for transit, biking and walking, and be sure to make it personal, explaining how biking, walking, and transit make your life better. We’re on the right track, and it would be devastating to derail this momentum.
This is now our eleventh year reporting on the data for the 60 largest US cities (2006) (2007) (2008) (2009) (2010) (2011) (2012) (2013) (2014) (2015). As the ACS has some flaws, these numbers should not be taken at face value (see below).
Commuting Stats of the 60 largest cities
Click on tabs to sort between modes
Totals: Biking + Walking + Transit
Total: Biking + Walking
What is the American Community Survey?
The American Community Survey is the country’s largest household survey, reporting its findings every year. The important thing to remember when reviewing the chart is that the data that we are using comes from workers who live in their city, and how they get to their job, wherever that may be. It’s also important to realize that in order to even be counted in the commuting survey, you need to have a job to commute to, so cities with higher unemployment rates will have a smaller representation in their lower income bracket. Also, the survey doesn’t take multi-modal transit users into account very effectively. If you ride a bike to a subway station, which mode are you using?
With a sample size of about 3 million addresses, this is only an estimate, but is by far the best tool that we have understanding trends in the United States. The survey uses questionnaires and interviews to gather information on demographic, economic, and housing characteristics.
ACS LIMITATIONS, NOTES, AND CAUTIONS
- The ACS asks only about commuting. It does not tell us about bicycling for non-work purposes.
- Results are based on a survey of a sample of the population. Surveys take place throughout the year. The journey to work question asks respondents about the previous week.
- The journey to work question asks about the primary mode of transportation to work. The wording of the question undercounts the actual amount of bike commuting that occurs. It does not count people who rode once or twice a week or people who bike to transit (if the transit leg is longer than the bike leg).
- Since the ACS is a survey of a sample, the results are estimates. The ACS releases a margin of error along with the estimate. Users can add and subtract the margin of error value from the estimate to find the top and bottom of the range within which the ACS is 90 percent confident in their estimate lies. Margins of error are reported on with the data on the ACS site.
- Changes among years may not be statistically significant.
- The numbers reported here are for the “principal city,” not the larger Metropolitan Statistical Area (MSA).

Sign up for Bike Pittsburgh’s newsletter, The Messenger, to get the latest news on events (including OpenStreetsPGH), bike and pedestrian infrastructure, and fun, delivered straight to your inbox. Twice monthly emails, no spam.