Climate, safety and affordability goals depend on better biking and walking
Report compiled by Tarush Bahl, BikePGH winter 2021 data intern
Since 2006, we’ve been reporting on the US Census’ American Community Survey (ACS) of commuting trends in Pittsburgh and across the 60 largest cities in the country, while sprinkling in a bit of analysis. Using the most recent 2019 data, we are able to come up with a synopsis of the last decade. Unless noted, we used the most recent data available: the 2019 ACS 5-year Estimates, released in December 2020.
7 Pittsburgh Commuting trends we found in the ACS

1. Bicycling Rate Increases Linked to Infrastructure Investments
Pittsburgh ranks 13th out of the 60 largest US cities in bike commuters with about 1.8% of employed residents biking to work. Examining Pittsburgh’s biking habits over the last decade, we find three distinct chunks in which our biking metrics are largely stable. The first is from 2010 to 2012, in which about 1% of Pittsburgh workers biked to work. This jumps to ~1.5% between 2013 and 2015, and up to ~2% in 2016 to 2019.
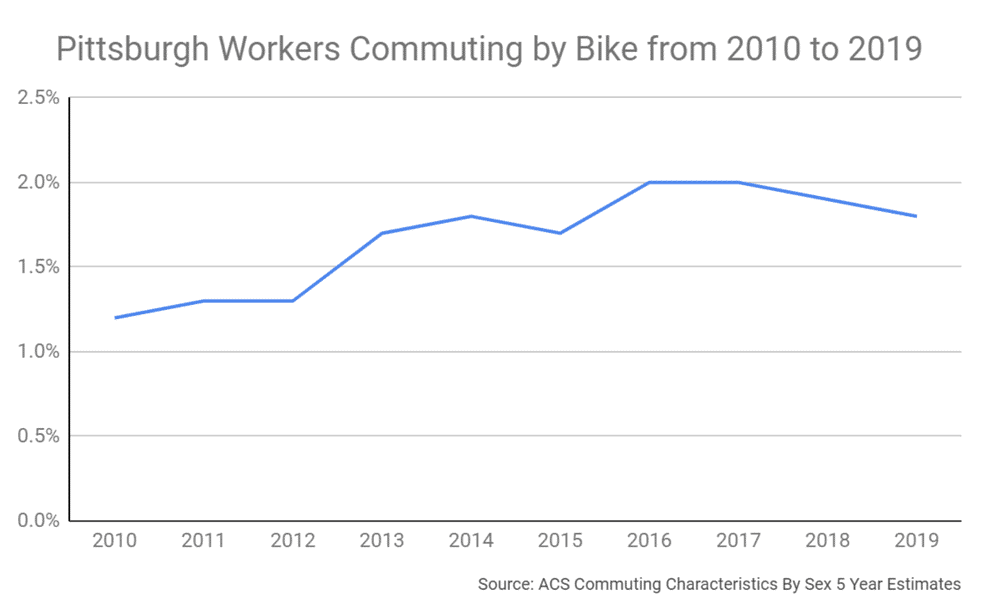
As more people ride when it becomes safer, according to NACTO, infrastructure investments in safety, accessibility, and ease of use all lead to increased biking, and point out the next steps the city should take to continue to improve. As Pittsburgh’s bicycling infrastructure, such as bike lanes, trails, and neighborways increases it’s unsurprising that the mode share of bicyclists also increases as more people feel safer to ride. The latest figures show that we need to continue to expand our network and close the major gaps if we want to reach the City’s climate, affordability, and safety goals.
2. Access to a Vehicle has Decreased
While the proportion of people driving to work has largely stayed the same, the number of workers with no access to a vehicle has increased from 11.6% in 2010 to about 13.7% in 2019. According to the ACS, about 32,000 Pittsburgh households have no access to a vehicle, or about 23% of households.
This indicates an increase in Pittsburghers depending on alternative forms of transportation. Increasing resources dedicated to support non-motor vehicle transportation is critical to ensure that Pittsburgh remains an affordable city, especially for the increasing number of us without a vehicle.
3. Stark Differences between the numbers of men and women bike commuters
The ACS provides us with a breakdown of transportation methods and trends between men and women (they do not distinguish gender nonconforming people). As the population split between women and men is about 50/50 (i.e. no percentage difference in number of each in Pittsburgh), we can use these numbers to be fairly indicative. With this, we find the following:
- 19.9% of women commuters use public transit vs 14.7% of men
- 64.2% men drive to work solo using their own car/truck/van vs 59.6% women
- 12.4% women walk to work vs 10% men
- 2.5% men bike to work vs 0.6% women
While the other points are quite interesting, we will focus on the differences and their biking habits. A Streetsblog analysis found that in Seattle, women may bike less because in addition to unsafe streets, they also are more likely to face discouraging problems such as driver harassment and inflexible workplaces. This is indicative of a trend where in the US, men bike on average three times more than women, while in many other countries, the split is closer to 50/50, as evidenced by 49% of bikers being women in Germany and 55% in the Netherlands.

4. Walkers levels remain high
The levels of walking in Pittsburgh has remained pretty constant over the last decade, with slightly over 10% of workers using it as their primary means. Out of the largest 60 cities, Pittsburgh ranks 5th in the percent of workers who walk to their job. With this many people walking, focus on walking conditions, maintenance, and pedestrian safety is imperative.
Despite a drop in overall traffic fatalities, pedestrian fatalities have increased, with deaths in 2019 being the highest recorded in 30 years and a 5% increase from the 2018 totals. Reasons for this jump may be due to factors such as increases in vehicle size, more driving overall, inebriated and distracted driving. The Washington Post reports how many of our roads were designed with cars, not people, in mind, and a need to prioritize engineering countermeasures in order to combat these rising numbers.
5. White Drivers Outpace Black Drivers
The ACS also provides us with data on transportation means by race. As we look through trends in this subset, we find that the increase in white drivers outpaces the increases in white workers in Pittsburgh. The number of white drivers increased by 11% over the last decade while the number of white workers increased by only 9.6%. In comparison, Black drivers increased by 16.1% while the number of Black of workers increased by 15.9%, indicating a more linear relationship between working and driving.
6. While Overall Driving Increases, Workers Below the Poverty Line Increasingly Dependent on Biking, Walking, Transit
Even though the total number of drivers is on the rise, when we examine by income level, we find that this is not the case for workers below the poverty level. Here, driving decreased by 6.2% over the decade, in comparison to a 16.5% increase for those reporting income above the poverty line. Couple this with the fact that the number of workers increased by ~14% since 2010, and the reliance of poorer workers on alternative transportation methods (other than driving) becomes clear.

7. Remote Work Sees Sharp Uptick over Decade
As the coronavirus pandemic has transformed the way people work in 2020 (and likely beyond), there was plenty of build up from the 2010-2019 period to set the stage for a shift in working habits. Remote working nearly doubled from 3.7% of Pittsburghers in 2010 to 6.9% in 2019. Looking further, we find that remote working decreased by 47.5% for workers below the poverty line, while remote working increased by 156.3% for those above the poverty line over the same time period.
2020 brought unprecedented shifts in how people work, but due to the nature of the underlying conditions of where Pittsburghers work, there is a risk of the trends being exacerbated. “Essential workers” like grocery clerks and those in healthcare often cannot work remotely. We will see how these impacts are reported when the 2020 numbers become available later this year.
More Interesting facts!
- Average commute times in Pittsburgh are about two minutes lower than the national average. Pittburghers spend on average 25.6 minutes commuting versus 27.6 minutes nationally (ACS 1-year estimates 2019).
- The average age of walking commuters is about 27, commuters who drive to work average 37 years old, public transit is about 33, taxi/bike/moto is about 30, while the average age of workers who work from home have declined from 39 in 2010 to about 34 today.
Conclusion
Roughly 15% of Pittsburgh workers primarily walk or bike to their job. Add in the remaining 17.7% of workers that take transit (all transit users walk or bike to transit first), and we find that nearly a third of Pittsburghers are reliant on walking and biking infrastructure. Investments here must continue to increase if we are to reach our city’s goals for climate, health, safety, and affordability.
2020 likely changed the way people will work forever, so much remains to be seen about how cities will need to adapt. Likely, we will see a sharp increase in remote work, so even if people do not have to commute to work as much, they will still need to get around for essential services such as groceries, healthcare, and entertainment.
What is the ACS?
The American Community Survey (ACS) is the country’s largest household survey, gathering data from workers that live in their city and how they get to their job, wherever that may be. The ACS reports its findings yearly. With a sample size of about 3 million addresses, this is only an estimate, but is by far the best tool that we have for understanding trends in the United States. The survey uses questionnaires and interviews to gather information on demographic, economic, and housing characteristics.
Reference Points:
Results are based on a survey that asks a subset of the larger population questions about their previous week of travel.
The ACS asks only about commuting, it does not tell us about bicycling for non-work purposes. This leaves out a significant group of people and only paints part of the true transportation picture.
When asking about an individual’s journey to work, the survey asks about “the primary mode of transportation to work.” This wording undercounts the actual amount of bike commuting as it does not consider people who ride only a few times a week or who utilize multimodal transit, like those who bike to a light rail station (if the transit leg is longer than the bike leg).
It is important to remember that these are estimates. The ACS does release a margin of error metric along with each estimate, which individuals can use to find the interval in which the ACS is 90% confident that the estimate lies within. This can be done by adding and subtracting the margin of error value from the estimate using the data on the ACS site.
Surveys take place throughout the year. This helps mitigate the problem that occurs with people changing the mode of transport based on the season/weather conditions but doesn’t resolve it fully.
Yearly changes may not be statistically significant.
The numbers reported here are for the “principal city,” not the larger Metropolitan Statistical Area (MSA), which means we’re only counting how residents of Pittsburgh get to their job, wherever that may be.
Previous years: 2006 | 2007 | 2008 | 2009 | 2010 | 2011 | 2012 | 2013 | 2014 | 2015 | 2016 | 2018