A deep dive into the stats and sources
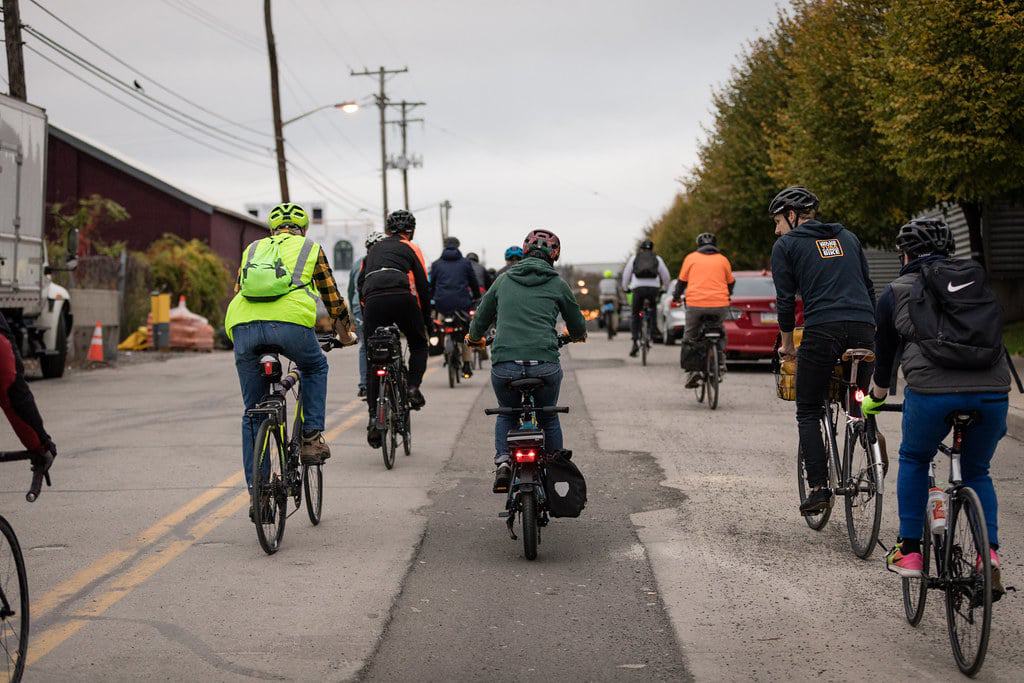
Bike Pittsburgh’s mission is to make biking and walking commonplace for all Pittsburghers, and in order to make biking and walking commonplace, there need to be safe and accessible methods for getting to and from home, work, the park, medical care, and all the other places people need to go each and every day.
Did you know that transportation accounts for 17% to 22% of overall household costs for the lowest two income quintiles in the United States, and the proportion of household expenditure on transportation is inversely correlated with income? (Institute for Transportation & Development Policy) This means the most economically disadvantaged among us spend the highest proportions of their income on transportation when compared to those who have more, meaning they have less money for savings, retirement, emergencies, you name it. It means these residents are less able to improve their economic status over the course of their lifetimes,” or achieve upward economic mobility. (University of Michigan).
It’s clear that Pittsburgh residents cannot realize economic progress without reliable, safe and affordable means to travel. We’ve gathered this research to express the economic impacts of mobility and access challenges, and how investments in bike and pedestrian infrastructure can improve the economic mobility of the most vulnerable and historically marginalized populations in our city and region.
Affordability, Access, and Equity
- 23% of Pittsburgh households do not have access to a car (American Community Survey)
- Black households are least likely to have access to a vehicle. And, households headed by POC overall are less likely than white households to have access to a vehicle in highly urbanized states and more rural states. (National Equity Atlas)
- The average price of maintaining a new car in the United States is $9,666 per year (AAA)
- Nearly 60% of people are in economic positions so precarious that they cannot manage an unexpected bill of $1000 (Survey, Bankrate).
- On an average income, half of a working week goes on paying for the costs associated with running an automobile, calculated philosopher Ivan Illich in his 1974 book Energy and Equity. “The typical American male devotes more than 1,600 hours a year to his car,” (Illich).
- New academic research has calculated that the lifetime cost of a small car is approximately $689,000, of which society pays $275,000. (The Lifetime Cost of Driving a Car, Gössling)
- Most lower-income and many moderate-income households are harmed overall by policies that favor automobile travel over more affordable and resource-efficient modes like walking, biking and transit. Instead, countries and cities should be designed so that “people can be mobile without a car.” (Gössling).
- While housing alone is traditionally deemed affordable when consuming no more than 30% of income, the H+T Index incorporates transportation costs—usually a household’s second-largest expense—to show that location-efficient places can be more livable and affordable. (CNT H+T Index)
- 20.5% of Pittsburgh is living in poverty (Census)
- In a large, continuing study of upward mobility based at Harvard, commuting time has emerged as the single strongest factor in the odds of escaping poverty. The longer an average commute in a given county, the worse the chances of low-income families there moving up the ladder. (The Impacts of Neighborhoods on Intergenerational Mobility, Harvard)
- Combining bicycling and transit can improve access to jobs, contribute to healthier lifestyles, reduce personal and household transportation costs, and increase transportation choice (Alta Planning + Design)
- Almost 15% of Pittsburgh’s population is too young to drive (Census)
- If workers cannot reach their destination in under 90 minutes, the Brookings model considers the destination unreachable by transit. According to this report, job access levels are lower in each of the 100 largest metro areas under reduced time thresholds. In only a few cases, however, do the rankings among metro areas change significantly. Pittsburgh show[ed] the biggest drop, falling from 32nd under 45 minutes to 79th under 90 minutes. (Brookings)
- Bicycle integration [with public transit] benefits transit by creating safer and more convenient connections to transit service, increasing transit ridership, producing healthier, safer and more livable communities around transit facilities, expanding the reach of transit, [and] providing affordable mobility for underserved transit customers. (APTA)
- 27.3% of Pittsburgh households are underserved by public transit (CNT, All Transit “Gap Finder”)
- The fastest growth in bicycling is among the Hispanic, African American and Asian American populations. Between 2001 and 2009, those three groups grew from 16 to 23 percent of all bike trips in the U.S. Black and Latino male workers are the most likely to work non-day shifts — 28.2% and 22.5% respectively — often commuting during the off-peak hours of public transit schedules that are vulnerable to cuts due to inadequate budgets, if off-peak service exists at all. For these individuals and many others, bicycling provides a viable mode of transportation. (The New Majority, League of American Bicyclists)
- Bicycling is an increasingly important mode of transportation, with bike commuting rising 47% nationwide between 2000 and 2011. From 2007 to 2011, the number of women commuting to work by bike grew by 56%. That growth was significantly higher in the largest Bicycle Friendly Communities (Pittsburgh is one), rising 80 percent over that same timeframe. People earning less than $30,000 per year accounted for 28% of bike trips in 2009 — more than 1.1 billion bike trips overall. (LAB New Majority Report)
- Bike lanes, trails, and even sharrows were not found to be associated with residential displacement, either along racial or economic lines (University of Colorado and University of New Mexico)
Safety, Health, and Environment
- BIPOC individuals and families are more likely to be victims of traffic violence (Governors Highway Safety Report, Dangerous by Design and USDOT National Roadway Safety Strategy)
- Estimated 2010 Economic Costs Due to Motor Vehicle Crashes in PA: $5.8 Billion (NHTSA)
- Bike lanes reduce injuries and fatalities for all road users (University of Colorado)
- Active Transportation like walking and biking are good for mental health including reducing stress (Study) and depression (Study)
- Transportation is much more than mobility; it is a social determinant of health. Healthy transportation maximizes community health by providing people with options for active travel, minimizes exposure to harmful pollutants, supports mental health, and supplies affordable and accessible travel options for people to reach essential goods and services. (ITE)
- Transportation is the number one contributor to climate change emissions in the United States, and cars and trucks (light duty vehicles) contribute 58% of climate change emissions within the transportation sector in the country (EPA)
- Climate Change is adversely affecting communities of color at higher rates (The Climate Gap, University of Southern California)
- In addition to climate change, cars and trucks emit ozone, particle pollution, and air toxics. The adverse health effects of mobile source air pollution affect millions of people, especially people who live near busy roads (PA DEP)
- Pittsburgh’s Climate Action Plan 3.0 calls for increasing biking from 2.5% to 10% of trips, increasing walking to 10 to 15% of trips. Double transit ridership while halving single occupancy car trips (Pittsburgh CAP 3.0).
- More than ⅓ of all trips taken in the U.S. are 2 miles or less. More than 40% of trips are less than or equal to 3 miles (bikeable distances if safe bike networks existed). (FHWA, National Household Travel Survey).
Return on Investment
- For every dollar invested in public transit it results in $5 in economic returns if there is sustained investment over 20 years (American Public Transportation Association)
- Evidence demonstrates that investments in bicycle infrastructure make good economic sense as a cost effective way to enhance shopping districts and communities, generate tourism and support business (League of American Bicyclists report on bicycle infrastructure)
- One study generally found that street improvements have either positive impacts on corridor economic and business performance or nonsignificant impacts. (National Institute for Transportation and Communities, Portland State University)
As we look to understand and address barriers to economic mobility through a holistic systems approach, it’s clear that investing in bicycling and walking mobility infrastructure will directly and indirectly serve community members facing social and economic challenges. Again, there’s never been a study that encapsulates this idea, so there’s more research to find and consider, and we always welcome people to send us research they’ve found. We know that biking and walking infrastructure isn’t a panacea to every aspect of economic mobility, but our elected leaders have to understand that this work contributes to the health, growth, and economic wellbeing of Pittsburghers.