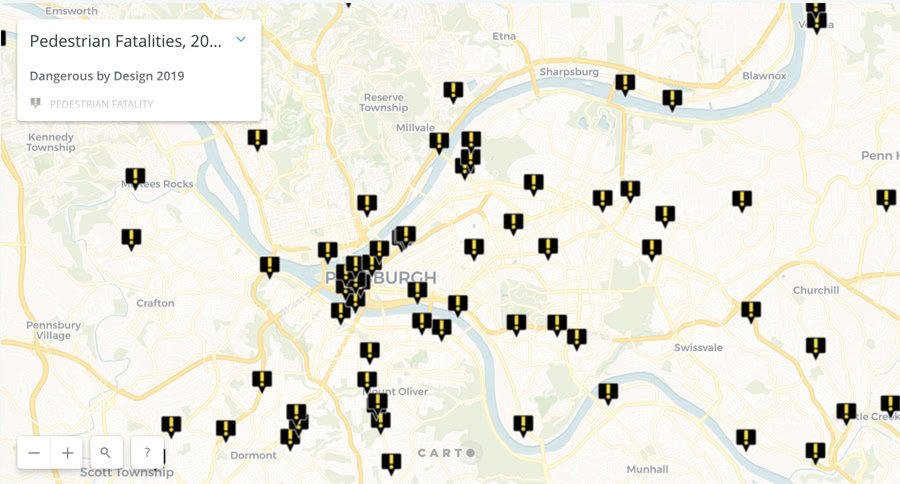
Dangerous By Design compiles the numbers on pedestrian fatalities in state and municipal areas
With bigger cars, more vehicle miles driven, cheap gas, distracted and aggressive driving, and poor pedestrian infrastructure, it’s no surprise that it’s gotten more dangerous for the American pedestrian.
Smart Growth America just release their latest Dangerous By Design report. In the report, we discover that between 2008 and 2017, “drivers struck and killed 49,340 people who were walking on streets all across the United States. That’s more than 13 people per day, or one person every hour and 46 minutes.” It’s as if a jumbo jet full of people crashed every single month.
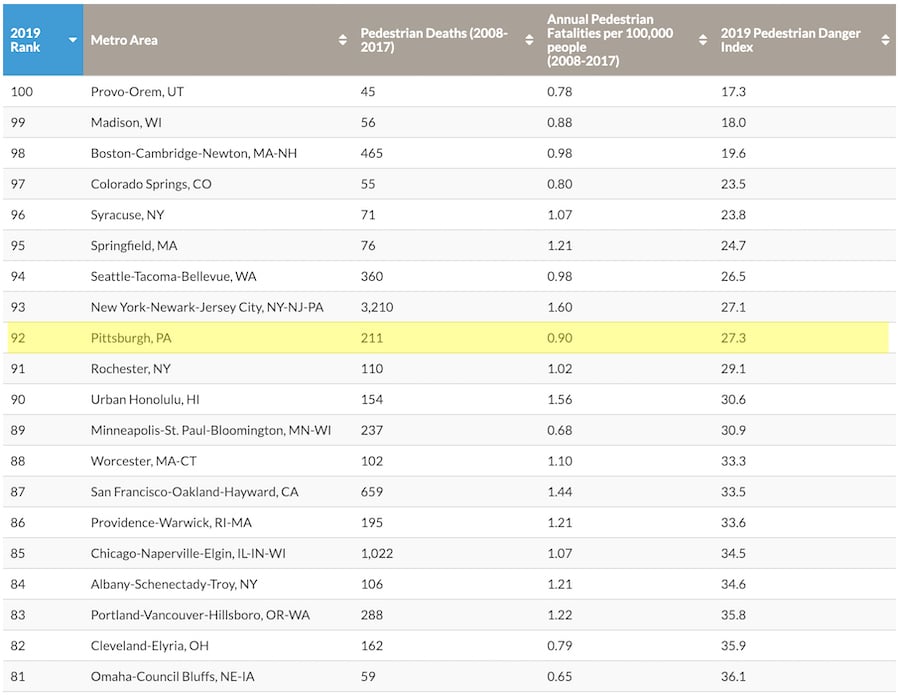
Nationally, 4 out of 5 metro areas, including Pittsburgh, got more dangerous for people walking. The report ranks states and metropolitan areas around the country using a “Pedestrian Danger Index”, or PDI. A PDI is a measure of how deadly it is for people to walk based on the number of people struck and killed by drivers.
With a PDI ranking as the 9th most safe metro area (out of largest 100), Pittsburgh is relatively safe compared to the rest of the country. Even with these credentials, we still unnecessarily lost 211 Pittsburghers over the past 10 years who were struck by vehicles while walking.
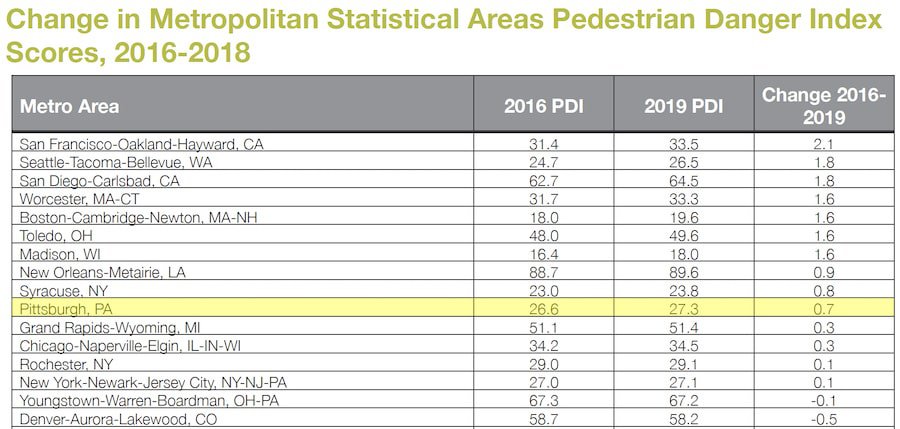
Additionally, our PDI has gotten slightly worse since the previous 2016 Dangerous by Design numbers, meaning that we are not doing enough to improve pedestrian safety as the metro area and driving habits change. More miles driven, more cell phone use, and high speeds create a deadly combination.
A few years ago, this report inspired BikePGH’s 2016 Pedestrian and Bicycling Crash Report, where we took a snapshot of the local crash and fatality numbers. We dug into the publicly available data, showing trends within Allegheny County as well as within the City of Pittsburgh. For instance, our report shows that a full 25% of all traffic fatalities and major injuries within the City of Pittsburgh involve pedestrians. Additionally, we found that aggressive driving was a factor in 23% of pedestrian crashes.

This Dangerous by Design report also digs into who are the most vulnerable pedestrian populations: older adults and people of color.
Older adults have the double disadvantage of not only taking more time to cross a street, but also are less likely to survive if a driver strikes them. Our friends over at Lively Pittsburgh have been raising awareness about this dynamic, and were acknowledged in the report as a national example.

Further, the report also calls out how people of color and low income communities comprise a second vulnerable population. Not only are people in these neighborhoods more likely to be dependent on getting around without a car, but a history of disinvestment has left many of these communities with sub-par pedestrian infrastructure and a smaller likelihood of maintenance. A task as simple as clearing the sidewalks of snow can be the difference between someone walking in the street or not.
Our solutions remain the same: Complete Streets. Slow down cars. Invest in better crosswalks. Put down the phone while driving. Prioritize pedestrians, especially our most vulnerable. Be sure our maintenance, our traffic signals and our forthcoming adaptive technology account for people on foot. Value safety over the flow of vehicles. Adopt Vision Zero.
To restate what we said in our Pittsburgh and Allegheny County report: “by targeting investment and safety improvements towards the approximately 300 pedestrian and bicycle crashes that occur each year, major injuries and traffic fatalities can be significantly reduced, if not eliminated.”
Click here to check out the full Dangerous By Design report.