Pittsburgh Walk & Bike Audit Guide
The work of transforming our communities from car-centric to great places to walk and bike has to start somewhere. Usually with neighbors who show up, document what they see, and make a specific ask to the people with power and resources to make improvements. This guide gives you the tools to do exactly that.

Introduction
A walk or bike audit is one of the most effective tools a neighborhood group can use to identify safety problems, brainstorm possible solutions on the ground, gather data, and build a compelling case for change. You go to a specific block, intersection, or a stretch of street to observe and document conditions, collect stories from neighbors who use that space every day, and bring those findings to the people who can fund, design, and build the needed improvements.
This guide is for neighborhood bike/ped committees who want a practical, Pittsburgh-specific resource for planning and running effective walking and biking audits. We’ve distilled the essential how-to so you can organize successfully.
Want to go deeper? The AARP Walk Audit Toolkit and Bike Audit Toolkit are excellent comprehensive references. We link to specific sections throughout this guide where their content adds useful depth.
Watch This Video To Get The Gist
Walk Audit vs. Bike Audit — What’s the Difference?
They’re very similar! One focuses on the biking experience, the other on the walking experience. You can include both in the same event.
- If you’re focused on biking infrastructure, you may still want to walk the area with an eye toward biking infrastructure. It’s hard to make good observations at biking speed. Walk together, and have a few people bring bikes to demonstrate and test conditions at key spots.
- If you’re auditing a longer stretch of road, you could ride as a group and pause frequently to discuss the experience.
Open the following sections to go deeper…
General How-To
Key Elements of a Walk or Bike Audit
A good audit keeps it focused and manageable:
- Plan a route or location — smaller is usually better: one street or even a few blocks instead of a whole neighborhood.
- Keep it short — 1 mile or less, slow-paced, with frequent pauses to observe and discuss.
- Set a purpose and goals — What do you want to accomplish?
- Do you want to identify problems you didn’t know about?
- Better understand issues you already know about?
- Persuade a council member or decision-maker to act?
- Educate neighbors and hear their stories?
- All of the above?
- Invite a diversity of neighbors and stakeholders — the more perspectives, the stronger your findings.

Two Types of Audits: Exploratory vs. Demonstration
Exploratory audits are about gathering data, listening, generating ideas, and educating neighbors. Use worksheets, take notes, and document everything.
Best worksheet for general walking data collection: AARP Sidewalks, Streets and Crossings worksheet
Demonstration (or “Show & Tell”) audits are about making the case to decision-makers. You invite elected officials, city staff, and/or media, walk them through the problem (literally) and call for specific action. See the Demonstration Walk Audits section below.
You can invite decision-makers to your initial exploratory walks, but you’ll typically make a stronger case once you already have clear data, stories, and a specific ask.
Who to Involve
The more diverse your group, the more complete your picture of the street experience. Aim to include:
- People who use wheelchairs, walkers, or other mobility aids
- People with low or no vision
- Parents with young children
- People of diverse ages, especially children and older adults
- People who bike, including people who don’t feel comfortable riding in traffic (they represent the majority of potential riders)
- Bus riders and people who walk to transit stops
- Elected officials
- City planners
One more thing worth being direct about: if the neighborhood you’re auditing is historically excluded from city planning and/or impacted by a history of disinvestment (perhaps due to racism, redlining, and/or poverty), make sure your audit team includes long-time residents who know that history. The goal isn’t to audit on behalf of a community. It’s to organize with them. If you only work with people who recently moved to an area, you risk collecting incomplete data that contributes to gentrification instead of authentic revitalization.
Event Planning
Give yourself at least three weeks — ideally a month — to plan and promote your event. And recruit neighbors to help so you’re not doing it alone. Working with other passionate walkers, people who bike, and transit riders on a walk audit is a great way to kick-off or rejuvenate a bike/ped committee!
Choosing a location:
- Near everyday destinations: schools, shops, homes, playgrounds, transit stops
- Smaller area = easier audit, more focused advocacy
- Larger area = bigger potential impact, but more complex to organize and communicate
- Look for spots where you can circle up to observe and discuss
- Consider multi-location vs. single-location formats
Choosing a time:
- Rush hour or school pickup/dropoff can reveal very different conditions than midday
- Consider lighting — audits at dawn or dusk surface issues that don’t show up in full daylight
- Visiting the same spot at different times of day and in different seasons can be especially revealing
Making it accessible:
- Scout the route beforehand and identify areas that are difficult for wheelchairs. Point those out during the walk even if the group has to route around them, but be safe and stay out of busy traffic.
- Consider a single-location audit at one intersection or stretch of street so participants can sit and observe instead of walking a full route.
- Make it welcoming for families with children:
- Give kids a specific job: “I spy,” counting driveways or other features, holding the clipboard, marking tallies for walkers/drivers/people on bikes, etc.
- Designate a volunteer or two to walk with the children so parents can participate more fully.
- Think about when the people you most want to reach are available. Don’t schedule during standard work hours if your neighbors work during the day, and avoid church or major sporting events on the weekends.
Recruitment
Getting neighbors to show up is often the hardest part. Some things that work:
- Personal outreach, not just mass emails. Ask specific people individually, and schedule around the people you most want there.
- Keep the time commitment short (90 minutes max) and the location convenient.
- Frame it around a specific concern people already care about.
- Put up flyers, get into local newsletters, make announcements at community events.
- Connect with your Registered Community Organization (RCO), Community Development Corporation (CDC), churches, businesses, food pantries, and other community organizations. Ask them to share with their networks, and whether you can speak at one of their upcoming meetings or events.
- Ask BikePGH to send an action alert to members and supporters in your area. Email advocacy@bikepgh.org.
- Reference this guide for more: Bike/Ped Committee Events Outreach Guide

Collecting Quality Data and Compelling Stories
Good audits produce two things: data and stories. You need both.
Why data matters: Good decisions and plans need good data. Numbers, measurements, and documented conditions give your report credibility and help decision-makers understand the scope of the problem.
Why stories matter: Decision-makers are moved by real people describing real experiences: a neighbor who missed the bus because there’s no curb cut at the stop, or a parent who won’t let their kid walk to school. Such stories drive action in ways that statistics alone don’t.
Resources for data collection:
- Make a map! Print or draw a map of your audit area and give everyone a copy. Ask participants to mark it up with concerns and ideas, then collect the maps at the end.
- Use Google Maps to print the area
- Or use a design tool like Canva to add context and visuals
- Example: Swissvale Walk Audit Map
- AARP Worksheets: these worksheets provide a systematic way to understand who is using the street/intersection, what’s working well, what needs improvement, and to document your ideas. Use the summary sheet to collect tallies from other worksheets to help inform your final report.
- Rating your findings: Both AARP toolkits recommend rating each location on a simple scale — Great / Acceptable / Mixed / Poor — based on how safe and welcoming it is for pedestrians or people biking. Adding a rating makes your report easier to read and makes it possible to compare locations or track changes over time. The Walk Audit Toolkit worksheets all include this rating prompt.
- Pittsburgh’s Safe Sidewalks Crew Survey: the Pittsburgh Walks pedestrian advocacy coalition is training volunteers to collect data about the sidewalks in their neighborhood. Learn more and attend a training at pittsburghwalks.org/sidewalks!
During the audit:
- Collect filled-out maps and worksheets at the end of the event.
- Take your own notes (or designate a note-taker) about what people say during the walk.
- Take photos and short videos of conditions. Visual evidence is essential for a good report.
Supplies and Tools
- Worksheets — the go-to set for walk audits is the AARP Walk Audit Toolkit. For routes near schools, the Safe Routes to School Walk Audit Toolkit includes forms focused on that context.
- Clipboards
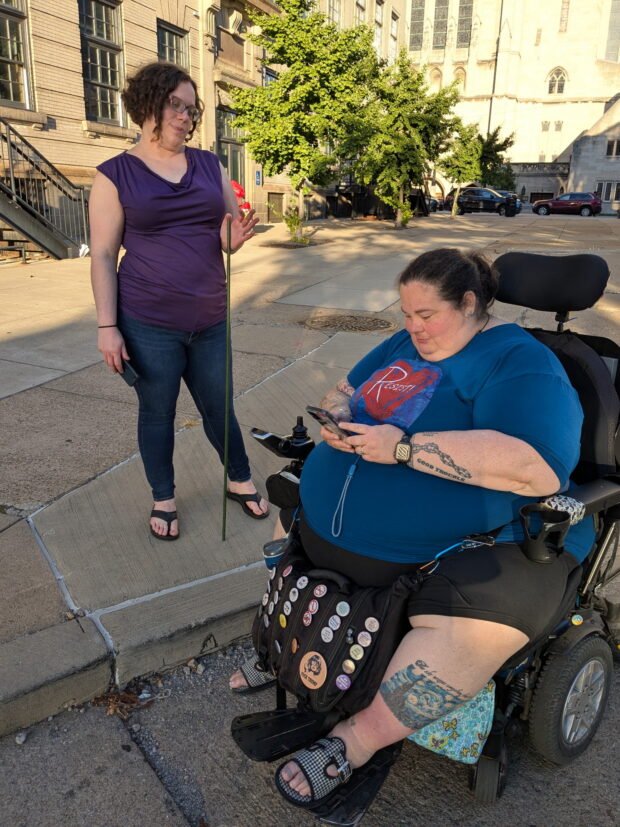
- Measuring tools — a 4-foot tomato stake or string cut to 4 feet works well for sidewalk width checks.
- BikePGH speed gun (email BikePGH to borrow)
- Camera or phone for photos and video
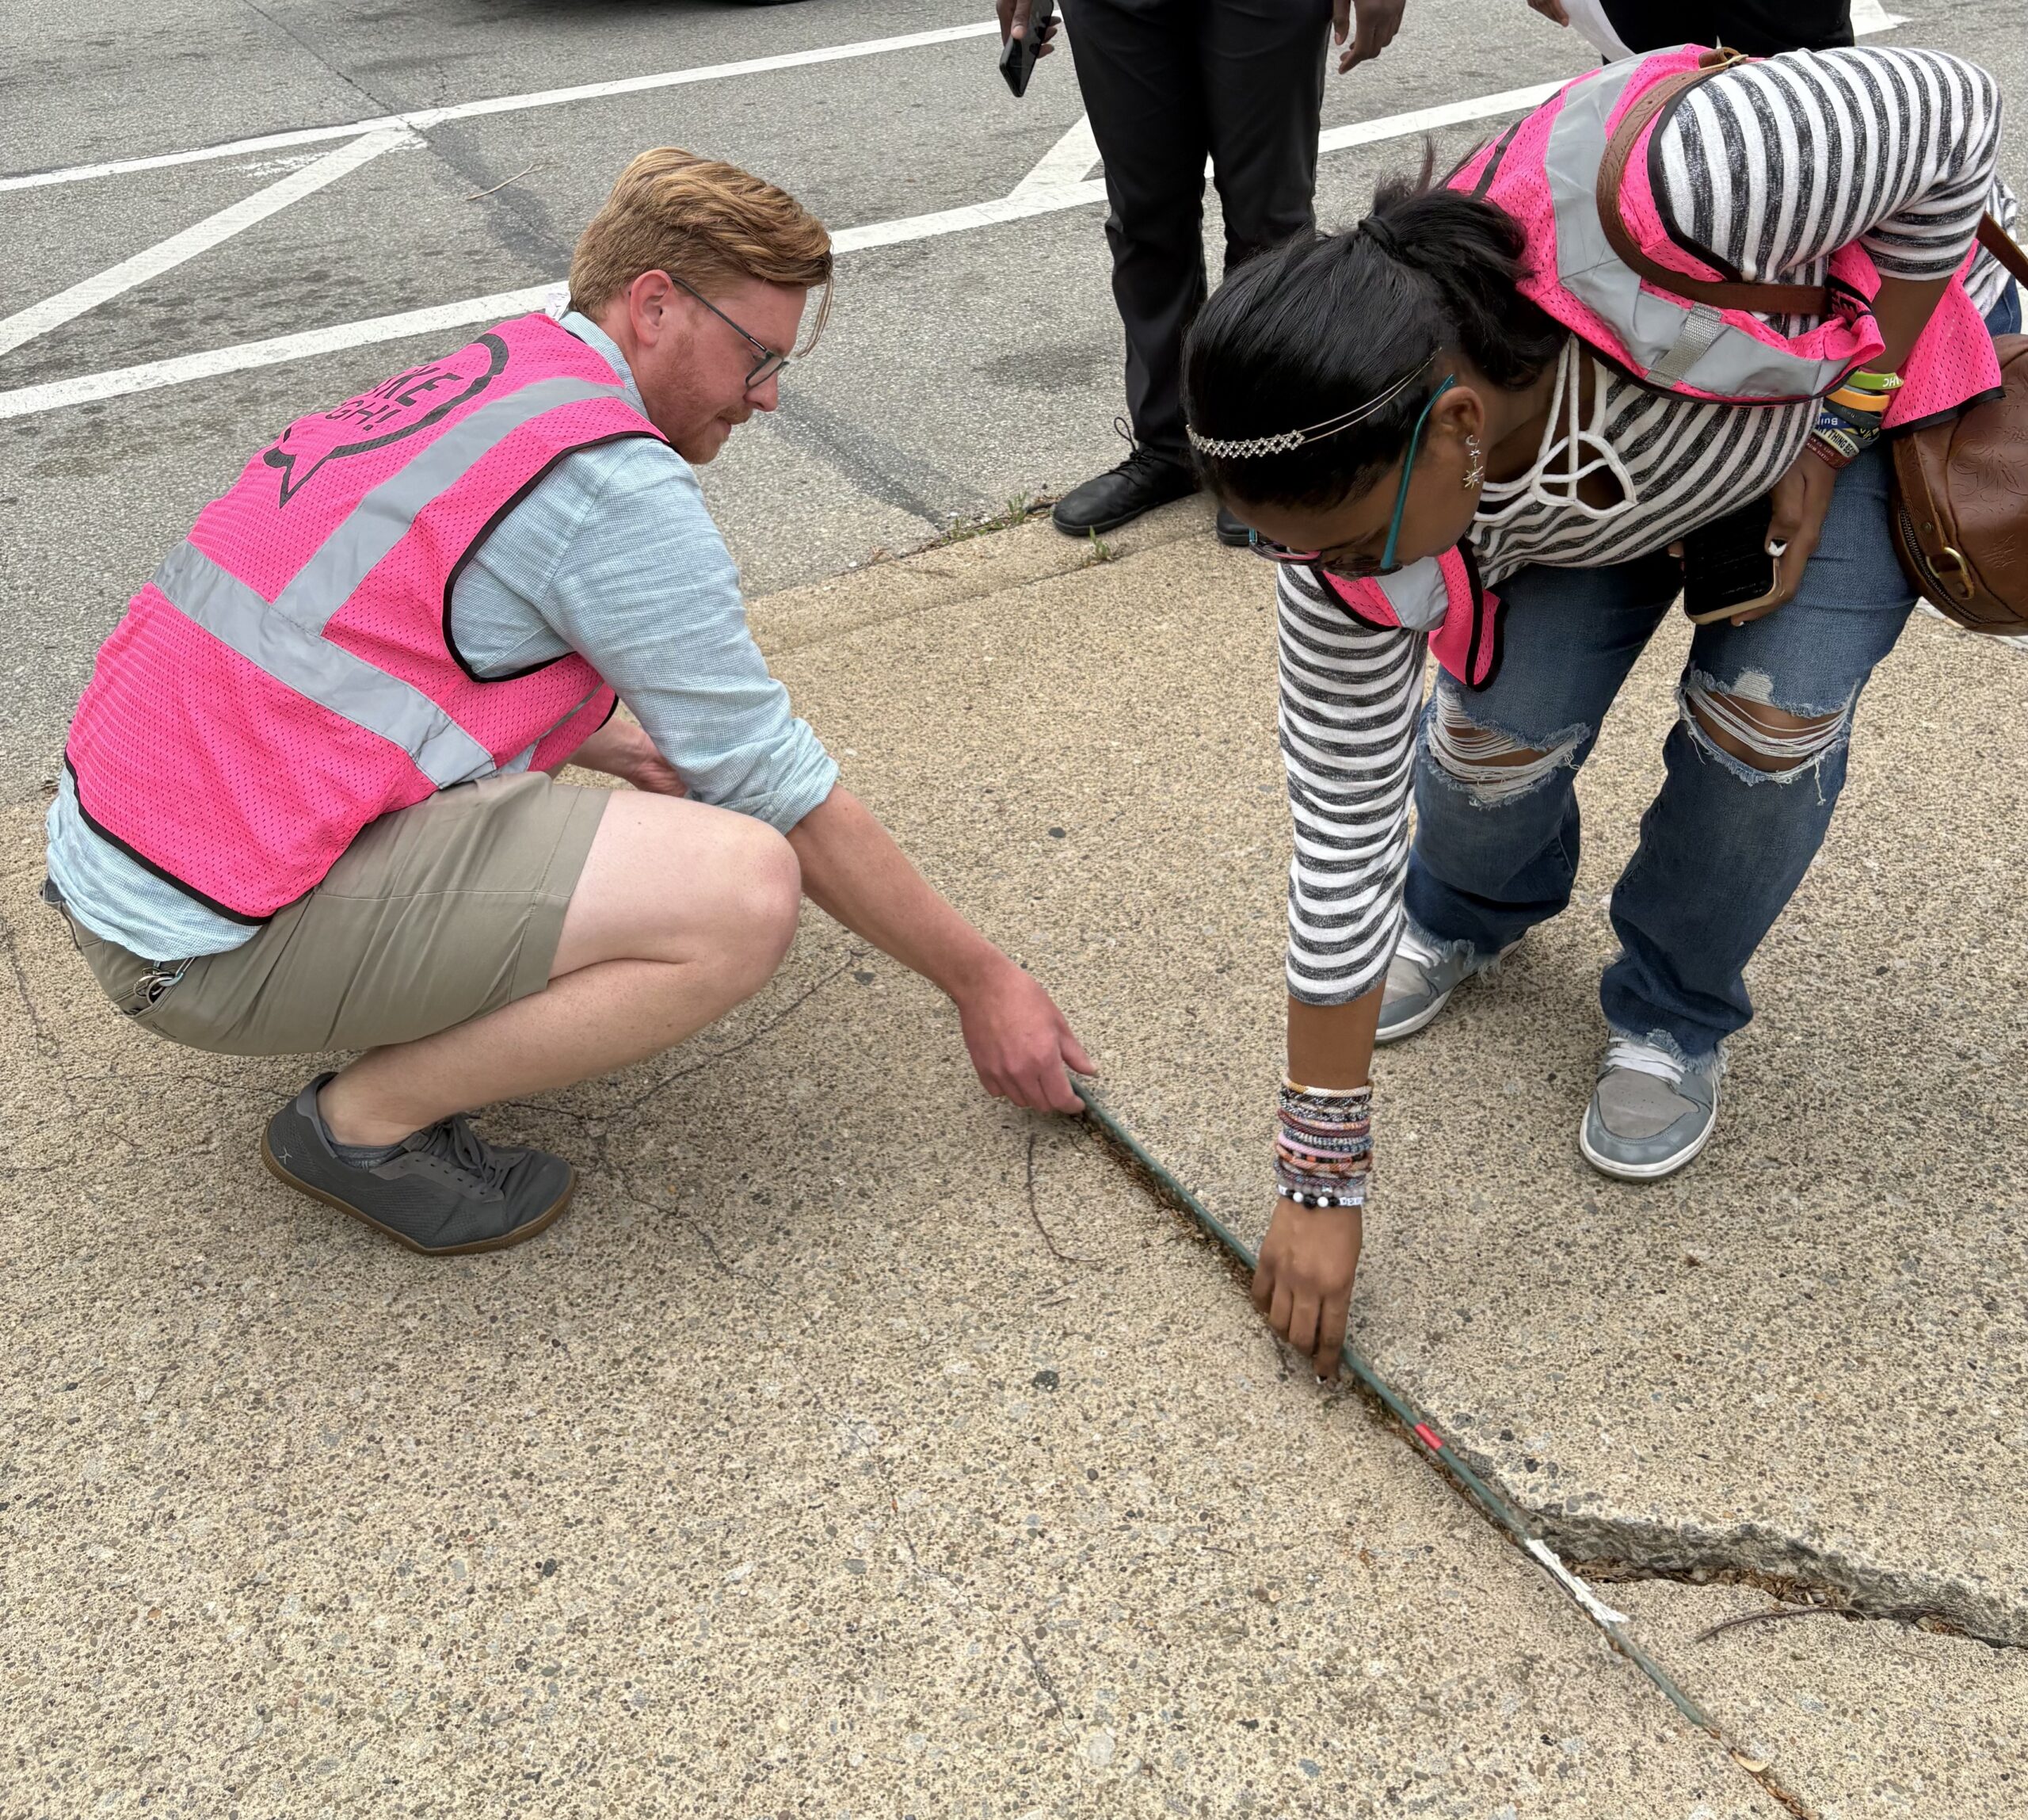
- Safety vests (borrow from BikePGH)
- Printed maps — one per participant, with space for notes.
Participant Roles
Assigning specific roles keeps the audit focused and ensures you collect good data. Consider:
- Worksheet fillers: Print 2+ copies of AARP walk audit worksheets you think are relevant and assign people to fill out each one during the walk.
- Measurer: Sidewalk widths (ideally 4′ or wider), bump heights (ADA requires ¼” or less). Use that 4′ tomato stake or string!
- Photographer/videographer: Document conditions for the report.
- 311 reporter: File reports on specific defects in real time. Use our 311 guide!
- Safe Sidewalks Crew data collector – submitting sidewalk surveys is a great way to get the data directly to DOMI!
- Child’s-eye-view participant: Ask someone to crouch to the height of an 8-year-old from time to time and experience the street from that perspective. It’s typically scarier than an adult’s view!
- Wheelchair or stroller user: If someone uses a mobility aid, invite them to share their experience, which may be some of the most compelling data and testimony you can collect.
- Map annotators: Give everyone a clipboard and map with space for notes. Collect them at the end, or let people keep them depending on your goals.
Discussion Starters
A “five finger shoot” is a good conversation starter. Ask people to put up 0–5 fingers on the count of three, where 0 is the worst walking or biking experience ever and 5 is the best. Then ask a few people with low numbers and a few with high numbers to explain. You’ll get a quick, honest range of perspectives to stimulate further conversation.
Safety During the Audit
- Borrow safety vests from BikePGH — email advocacy@bikepgh.org
- Consider lighting and time of day
- Light rain is fine — it can actually surface drainage issues. Skip it in lightning.
- Keep the group size manageable so people aren’t spilling into the street
- Scout the route beforehand to identify any areas to avoid or flag
- Start with a brief safety talk about what to expect
- Look out for poison ivy!
What Can Go Wrong (and How to Handle It)
- Low turnout — publicize early, personally invite neighbors, keep the time commitment short.
- Bad weather — have a rain plan; light rain can actually demonstrate drainage problems and slippery conditions effectively.
- Participants going off-topic — keep a “bike rack” list of topics that come up that are outside the route or purpose of the audit, and come back to those at the end or some other time so you can stay focused.
- Officials cancel or don’t show — still run the audit; document findings and send a written summary afterward.
What to Look Out For
Before you go on your walk or bike, it’s worth getting familiar with some streetscape vocabulary. When you can name what you’re looking at, your reports and conversations with DOMI and city planners carry more weight.
- Pedestrian vocabulary: “A Streetscape Vocabulary List” in the AARP Walk Audit Toolkit (pp. 10–11) defines terms like pedestrian islands, bulb-outs, curb ramps, Leading Pedestrian Intervals (LPIs), and pedestrian hybrid beacons.
- Cycling vocabulary: “A Cycling Streetscape Vocabulary List” in the AARP Bike Audit Toolkit (pp. 10–11) covers terms like sharrows, bike boxes, bicycle signal heads, buffered bike lanes, and contraflow lanes.
Walking
- Get down to child level. Crouch to the height of an 8-year-old and see what the street looks and feels like from their perspective.
- Use your senses. What do you see, hear, and feel? Close-passing cars, uneven pavement, inadequate lighting, noise from traffic are all data points. We hope you don’t notice too many smells and tastes beyond flowers and the snacks you brought.
- Bring something that rolls such as a wheelchair, stroller, or rolling cart to test accessibility from the perspective of someone who uses those tools every day.
- Look at transit connections. Are bus stops accessible and safe to reach on foot? Is there a clear, direct path from the sidewalk to the stop? Is there shelter or seating at the stop? These are walking infrastructure issues, and they matter enormously for transit riders — especially older adults, people with disabilities, and families with kids.
- For a complete checklist of what to look for, see the AARP Walk Audit Toolkit, p. 10.
Common walking issues to document:
- Missing or broken sidewalks
- Sidewalk obstructions: utility poles, overgrown vegetation, parked cars on the sidewalk
- Curb ramps: missing, cracked, or misaligned with crosswalk direction
- Crosswalk visibility and condition
- Signal timing — does the walk signal give people enough time to cross?
- Lighting, especially along routes to bus stops and school
- Accessibility for wheelchairs, walkers, and strollers
Legal Requirements for Accessibility
The Americans With Disabilities Act (ADA) and the 2023 Public Right-of-Way Accessibility Guidelines (PROWAG) set specific, measurable standards for pedestrian infrastructure. These are useful to know when documenting problems and when making asks to decision makers.
Width: The minimum clear width for a pedestrian access route is 3 feet (36 inches), and preferably at least 4 feet (48 inches). Where physical constraints prevent most of the sidewalk to be less than 5 feet (60 inches), 5 ft. x 5 ft. passing spaces must be provided at 200-foot intervals.
Running slope (the incline along the direction of travel): Maximum 5%, unless the sidewalk follows the natural street grade. Anything steeper is technically a ramp and must meet ramp standards, including handrails and level landings.
Cross slope (the tilt side-to-side, perpendicular to travel): Maximum 2%. This matters a lot for wheelchair users because a steeper cross slope could push the chair toward traffic or a wall, making travel genuinely dangerous.
Surface condition: The surface must be stable, firm, and slip-resistant. That rules out broken pavement, gravel patches, roots heaving the concrete, or surfaces that become slippery when wet.
Vertical discontinuities (cracks, gaps, lips): Changes in level up to ¼ inch are allowed. Between ¼ and ½ inch, the edge must be beveled. Anything over ½ inch is a violation. This applies to cracks, pavement gaps, utility covers, and the joint between a curb ramp and the street.
Curb ramps: Must be at least 4 feet wide, with a maximum slope of 8.33% (1 in. of rise per every 1 ft. of run). No vertical lip is allowed between the ramp, gutter, and street surface — that gap is one of the most common and most dangerous defects. Counter slope (the grade of the street across the ramp) can’t exceed 5%.
Openings in grates and covers: Any openings must be small enough that a ½-inch sphere can’t pass through them, and oriented perpendicular to travel so they can’t catch a cane or wheelchair wheel.
One note on Pittsburgh’s hilly terrain: steep grades don’t eliminate ADA obligations, but there is a narrow exemption when achieving compliance would require fundamentally altering the character of a street. Still document steep, inaccessible slopes. Even if technically not an ADA violation, they’re real barriers worth advocating to address.
Biking
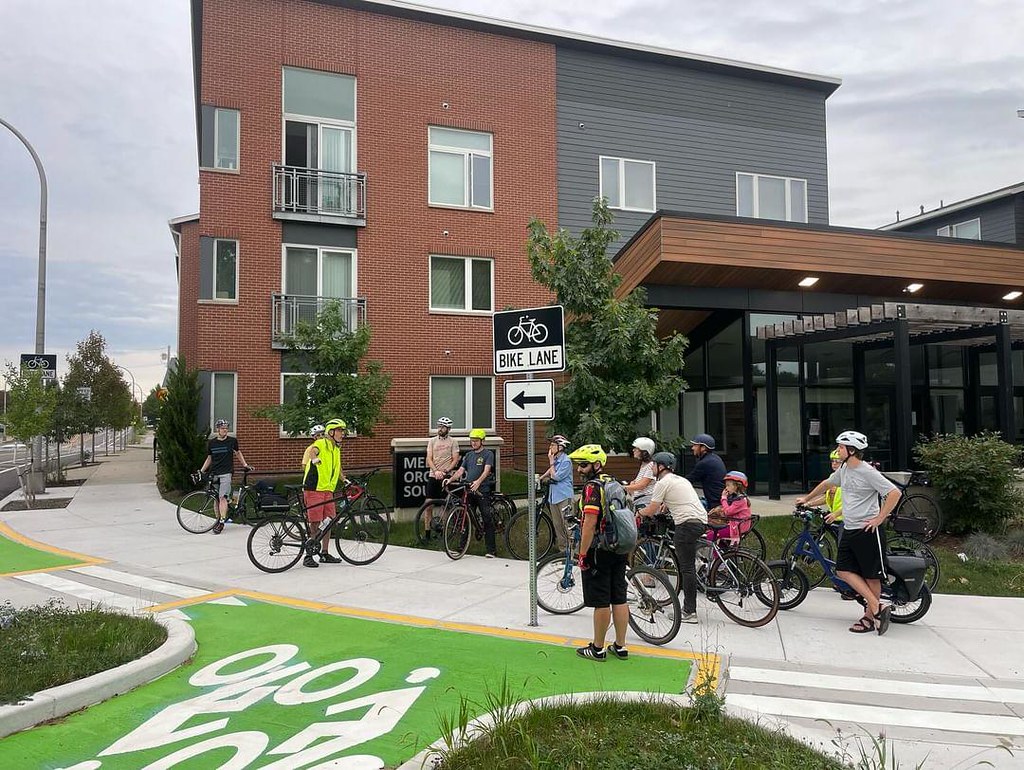
Who are you designing for? The AARP Bike Audit Toolkit (p. 9) describes three types of bike riders: Strong & Fearless (comfortable riding with vehicle traffic, little infrastructure needed), Enthused & Confident (prefer protected paths but willing to use unprotected lanes), and Interested but Concerned (want to ride, but only where conditions feel safe and calm). That last group represents more than half of U.S. adults. If your goal is to get more people biking, the infrastructure needs to work for them — not just the confident riders who are already out there.
Bike lane types matter. Not all bike infrastructure provides the same level of protection. The AARP Bike Audit Toolkit’s “Bike Lanes and Infrastructure” section (pp. 12–13) breaks down the differences between conventional (paint-only), buffered, protected, contraflow, and shared-use lanes, and what makes each more or less safe in different contexts. The “Volume × Speed = Bike Lane Type” graphic on p. 13 is especially useful for explaining to officials why some roads need physical protection while others can work with paint alone. “Creating a Protected Bike Lane” (p. 13) also explains different barrier types: bollards, flex posts, planters, parking stops, and jersey barriers.
Common biking issues to document:
- Pinch points where the lane narrows or disappears
- Low-visibility areas: curves, hills, unlit stretches
- Intersections with poor signal design or timing
- Areas where a bike lane would create dedicated space and reduce conflicts between people biking and drivers
- Sharrows that are worn, faded, or barely visible
- Bike parking: Note quantity, quality, security, and proximity to building entrances. Is there enough short-term parking for shoppers and visitors? Long-term parking for employees? The AARP Bike Audit Toolkit “Bike Parking” section (p. 16) and Worksheet #8 provide a structured checklist for evaluating parking quality.
- Transit connections: Note whether bus stops have places to lock a bike and whether buses serving the area have working bike racks. Every PRT bus should have a bike rack. Are people using them? Do they work? A bus bike rack lets people who bike extend their range onto routes where roads aren’t bike-friendly — a direct connection between cycling and transit access.
Complete Streets
A “Complete Street” is designed to work for all users: people walking, biking, riding transit, using wheelchairs, or driving. Pittsburgh has a Complete Streets policy, which gives advocates a policy hook when making asks of city officials. You’re not asking for something new, you’re asking the city to follow its own adopted policy.
Learn more about Pittsburgh’s Complete Streets policy and how BikePGH uses it in advocacy: bikepgh.org/complete-streets
For more on the concept and what Complete Streets look like in practice:
Demonstration (“Show & Tell”) Walk Audits
Demonstration (“Show & Tell”) Walk Audits

Demonstration audits are about making the case to decision-makers by showing them the problems and opportunities, not just telling them. You invite elected officials, city staff, and/or media, and walk them through the problem — literally. The goal is a specific commitment to act.
When to do a demo audit: You can invite officials to your initial exploratory walks, but you’ll typically be more persuasive once you have data, stories, and a clear ask already in hand. Do the exploratory audit first.
Make your case using this structure:
- Problem — what’s wrong and who it affects.
- Solution — what specifically you’re asking for. See below for more guidance.
- Benefit — why it matters for the community, consider diverse beneficiaries.
- Call to Action — what you want the decision maker to commit to.
And read our Grassroots Advocacy Toolkit for more guidance about how to communicate your issue.
Tell stories. Identify people who have been affected by current conditions: near misses, crash victims, people with disabilities whose independence is limited by poor infrastructure, families who feel unsafe, transit riders who can’t safely reach their stop.
Have 1–3 people talk briefly about their experience at key points on the walk, and be sure to prep storytellers in advance. It’s natural to be nervous, and preparation helps them stay focused and avoid tangents.
Consider recording video of people’s stories for future use such as on social media!
Prepare your talking points with statistics and data from:
Think strategically about who to invite. You will almost certainly want to invite your councilperson, but who else? Email advocacy@bikepgh.org for help with this. We can probably help you get in touch with the right people.
Talk with your councilperson early — at least a few weeks out — to find a date that works and ask for their help inviting other stakeholders: DOMI, the Mayor’s Office, City Planning, PennDOT, even local businesses, churches, and community groups.
PennDOT roads: If the street is a state route, consider inviting your State Rep and/or State Senator, who may have more power over what happens on State roads than your City Councilperson.
Media strategy: Think carefully before inviting media. If they show up, elected officials may become more guarded and the event shifts from a collaborative conversation to a public performance. Media can be useful if your councilperson has been resistant or noncommittal because public attention can move people who won’t move otherwise. If the goal is to build trust and problem-solve together, though, media-free is usually better.
Know Your Jurisdiction
Different infrastructure is owned and maintained by different entities. Knowing who’s responsible for what is essential before you make asks or write reports. Pointing fingers at the wrong agency slows everything down.
Who Owns What
- City of Pittsburgh (DOMI): Local streets, bike infrastructure, and some sidewalks within city limits.
- Allegheny County: County-designated roads and bridges. Also, Pittsburgh Regional Transit (PRT) is part of the County, and they own various properties like bus stations and stretches of road like busways.
- PennDOT: State routes (look for the route number sign) — these often include major corridors running through neighborhoods.
- Private: University campuses, shopping malls, cemeteries, churches, and large buildings often own private streets, driveways, walkways, and plazas. Also, maintaining and repairing sidewalks is the the responsibility of the adjacent property owner.
Use the Who Owns My Infrastructure map to figure it out.
Who to Contact and When
Getting clear about your ask before you make contact makes the conversation more productive.
- Your City Councilperson — contact them at least 2 weeks before the audit if you want them to attend; share the summary report within a week after
- DOMI (Department of Mobility and Infrastructure) — submit 311 requests for specific defects; share your full report for systemic issues. Here’s our guide.
- Local community organizations (such as your RCO or CDC) — they often have standing relationships with city departments and can help amplify your findings. Find yours here.
- State legislators — if the street is a PennDOT route, your State Rep or State Senator may have more ability to help than your City Councilperson.
Frame your ask clearly upfront: are you asking for a specific fix, a study, a meeting, or just raising awareness? Being clear makes follow-up much easier.
Reporting
Getting your findings out of a notebook and into the hands of decision-makers is where impact happens. A good report is short, readable, and specific.
What to Include
A solid walk or bike audit report doesn’t need to be long. Hit these points:
- Opener with photo — grab attention with a striking image of the problem
- The problem — clear, specific description with any crash data or count data you collected
- A map — marked up with your key findings
- Observations — highlights from your worksheets and notes; not everything, just the most compelling
- Why it matters — who is affected and how; include 1–2 resident stories if you have them
- Proposed solutions — specific asks (see below)
- Contact information — who to reach with questions or next steps
Format options: A short written report, a one-page handout, a PowerPoint presentation, and/or a video can all work. Choose based on your audience and the formality of the situation. See sample reports in the AARP Walk Audit Toolkit (pp. 16–17) and AARP Bike Audit Toolkit (pp. 18–19) for examples of how to put this together.
Propose Solutions, Not Just Problems
Elected officials hear about problems constantly. What moves them to act is when someone shows up with a problem and a specific proposed solution. Knowing the terminology also shows you’ve done your homework.
(Note: avoid getting too specific such as where exactly to put a speed hump or bike lane. You might just get a “no that’s not possible” instead of an open conversation.)
Here’s a checklist of common infrastructure solutions for walking, biking, and the connections between them:
Walking:
- Curb ramp installation or repair
- Sidewalk repair or gap fill
- Pedestrian island (refuge island) at wide crossings
- Bulb-out / curb extension — widens the sidewalk, narrows the crossing, slows traffic
- Crosswalk installation or repainting
- Raised crosswalk — flush with the sidewalk, increases visibility and slows cars
- Pedestrian hybrid beacon or HAWK signal for mid-block crossings
- Leading Pedestrian Interval (LPI) — gives walkers a head start before cars get the green
- Signal retiming to give pedestrians more time to cross
- Pedestrian-scaled lighting (lower fixtures aimed at sidewalks and crosswalks)
- Road diet (aka “right sizing”) — reducing vehicle lanes to slow traffic and create space for people
- Parklet — converting a parking spot into outdoor public space
- Tree canopy / shade for long stretches of exposed sidewalk
Biking:
- Conventional bike lane (paint-only)
- Buffered bike lane (painted buffer zone between the lane and traffic)
- Protected bike lane (physical barrier: bollards, flex posts, planters, or parked cars)
- Bike box (intersection holding area for cyclists in front of cars)
- Contraflow bike lane (two-way cycling on a one-way street)
- Sharrow repainting or upgrade (shared-lane markings)
- Bicycle signal head (dedicated traffic signal for cyclists)
- Bike parking installation: U-racks, corrals, secure long-term storage
- Bus bike rack (lets cyclists hop onto transit where roads aren’t bike-friendly)
For photos and descriptions of many of these solutions, see:
- AARP Walk Audit Toolkit: “Strategies for Safer Streets” (pp. 20–23)
- AARP Bike Audit Toolkit: “Strategies for Safer Streets and Cycling” (pp. 22–27)
A Note on Defining a “Win”
A successful audit doesn’t require the infrastructure problem to get fixed. If your audit galvanizes your group around an issue and launches a campaign, that counts. Document and share these process wins. They’re more common than resolved infrastructure, and just as valuable for demonstrating impact to your organization and community.
Influencing the Capital Budget
Consider including data and stories from your audit report in a capital budget request to fund specific infrastructure improvements. BikePGH’s capital budget guide walks you through how to do this.

Testifying at Public Meetings
If sharing your report doesn’t get traction, testifying at a public meeting is a powerful next step, especially if local officials have been unresponsive or unwilling to meet. Most municipal council meetings include public comment time, typically 2-3 minutes per speaker. This tactic is often the only way to register concerns with small municipal governments, but we have found that it is less effective for campaigns within the City of Pittsburgh where it’s better to go straight to your councilperson.
Tips:
- Sign up for public comment in advance (check your municipalities website for deadlines and instructions).
- Bring others along to split the presentation. Instead of one person with 2 minutes, three people gives you 6 minutes total across different voices and perspectives.
- Lead with your most compelling story or data point. Don’t save the best for last!
- Email BikePGH at advocacy@bikepgh.org for tips from experience.
For general testimony guidance, see the AARP Walk Audit Toolkit (p. 18) and AARP Bike Audit Toolkit (p. 21).
Additional Resources
Reports:
Toolkits:
- AARP Walk Audit Toolkit
- AARP Bike Audit Toolkit (How many Pittsburgh pics can you find?)
- AARP Sidewalk + Steps Audit Worksheets (made by BikePGH volunteer Laura Zurowski)
- Safe Routes to School Walk Audit Toolkit
- Student-Centered Walk Audits for HS Students w/ Disabilities
- NHTSA Walkability Checklist
- Check out our Bike Bus Guide – Leading a bike/walk “bus” is a great opportunity to identify needs and opportunities!
Reporting and data tools:
Ready to Plan Your Audit?
BikePGH is here to help. We can connect you with resources, review your report, help you prepare for a demonstration audit, or send an action alert to members and supporters in your area. Email advocacy@bikepgh.org for one-on-one help, or attend one of our monthly advocacy booster calls.
Coming Soon
We’ll be adding more resources here over time, including:
- Additional guidance for municipalities outside the City of Pittsburgh: county-level resources, testifying before commissioners, active transportation planning grants
- Winter weather audits
- Auditing public stairways
- Leading “safe routes to school” walk audits with kids
- Telling compelling stories
- What exactly does the ADA require, and what on earth is a PROWAG?
- Recorded interviews with local advocates about their experience